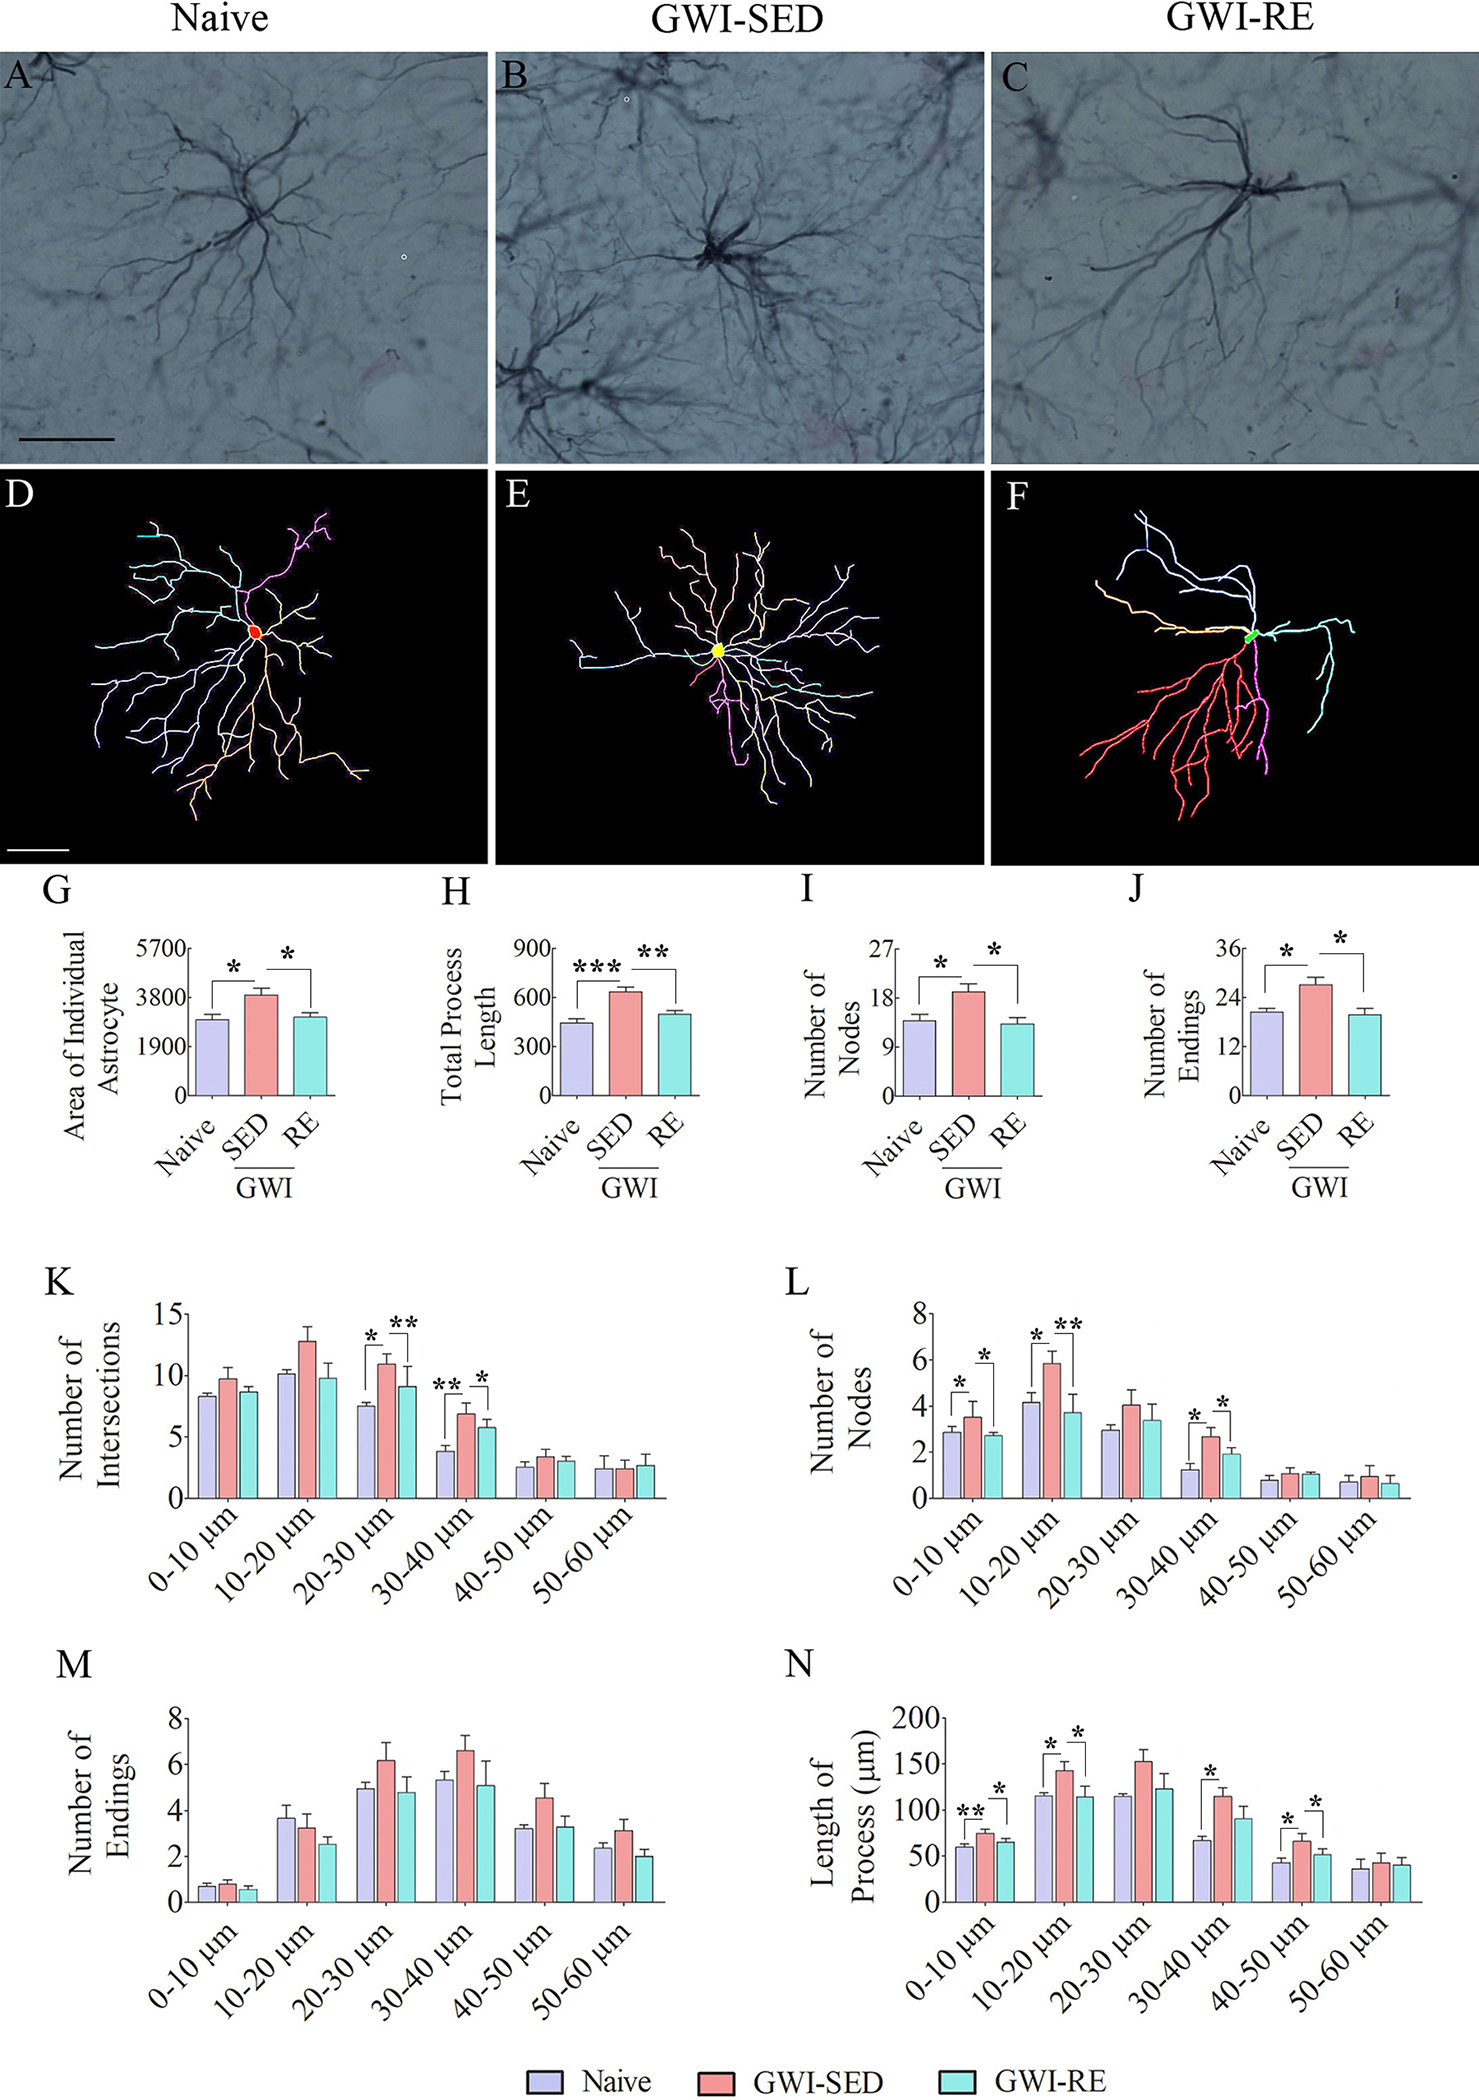
Fig. 6. Thirteen weeks of moderate voluntary, intermittent running exercise (RE) reduced reactive astrocyte-like morphology in the hippocampus.

A-F shows representative examples of astrocyte morphology traced with Neurolucida from the hippocampus of naive (A, D), GWI-SED (B, E), and GWI-RE (C, F) groups. Note that astrocytes from GWI-SED rats display longer processes with enhanced branching (B, E), whereas astrocytes from naïve (A, D) and GWI-RE rats (C, F) show shorter and less branched processes. The bar charts G-J compare the various morphometric measures between naïve, GWI-SED, and GWI-RE groups, which include the average area occupied by individual astrocytes (G), the total process length (H), the number of nodes (I), and the number of process endings (J). The bar charts K-N compare the number of intersections (K), total process length (L), surface area (M), and the number of nodes (N) between naïve, GWI-SED and GWI-RE groups at 0–10 μm, 10–20 μm, 20–30 μm, 30–40 μm, 40–50 μm, and 50 – 60 μm distances from the soma. *, p < 0.05; **, p < 0.01; ***, p < 0.001. Scale bar, A-F = 25 μm.
