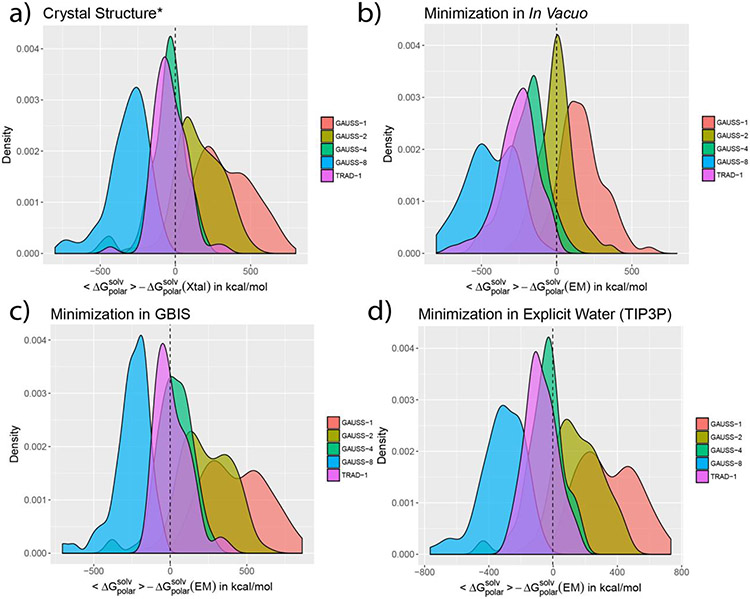
Figure 2:
The density distribution of the difference are shown for a) crystal (aka. Xtal) structure (* added protons are optimized) and structures minimized b) In Vacuo c) in GBIS and d) in explicit solvent (TIP3P). The labels ‘TRAD-x’ and ‘GAUSS-x’ indicate the traditional 2-dielectric and Gaussian-based smooth dielectric distributions, respectively. ‘x’ is the protein’s internal dielectric value. The dashed vertical line is at the zero mark in each plot.

