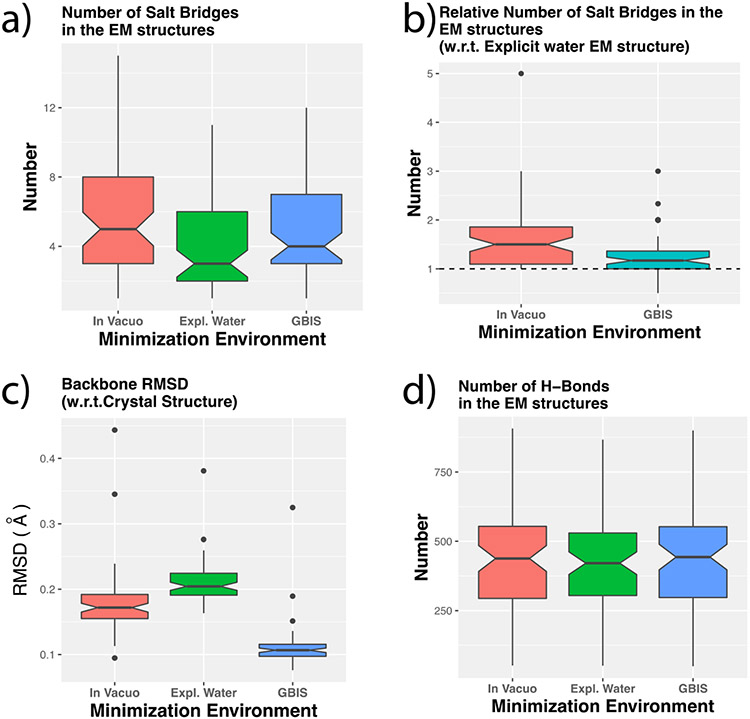
Figure 3:
Boxplots showing (a) the distribution of the number of SBs in the energy minimized (EM) structures from the three environments, (b) the number of SBs for in vacuo and GBIS EM structures relative to that from explicit water environment, (c) the backbone structural RMSD of the structures relative to the crystal structure after minimization in the corresponding environment, (d) the number of intra-protein hydrogen bonds in the EM structures after minimization in different environments. The dotted horizontal line in (b) indicates the unity mark.

