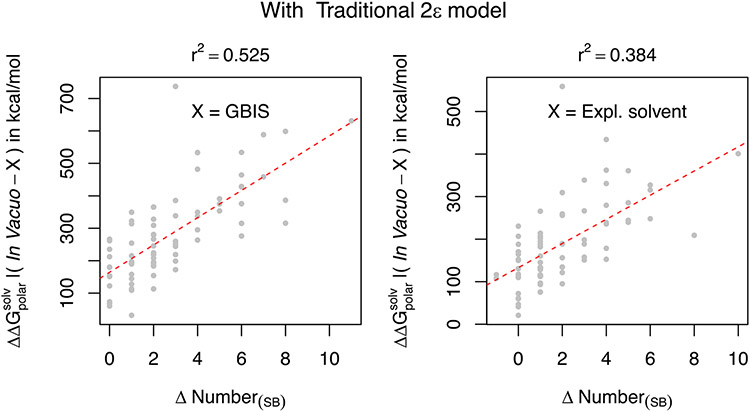
Figure 4:
The difference of the , computed using the traditional 2ε dielectric model of the in vacuo and solvent minimized structures is plotted as a function of the difference of the number of salt-bridges in those structures. Left plot corresponds to GBIS and the right plot corresponds to explicit solvent (TIP3P). The quality of the linear fit (dotted red line) is quantified by the square of Pearson coefficient (r2).

