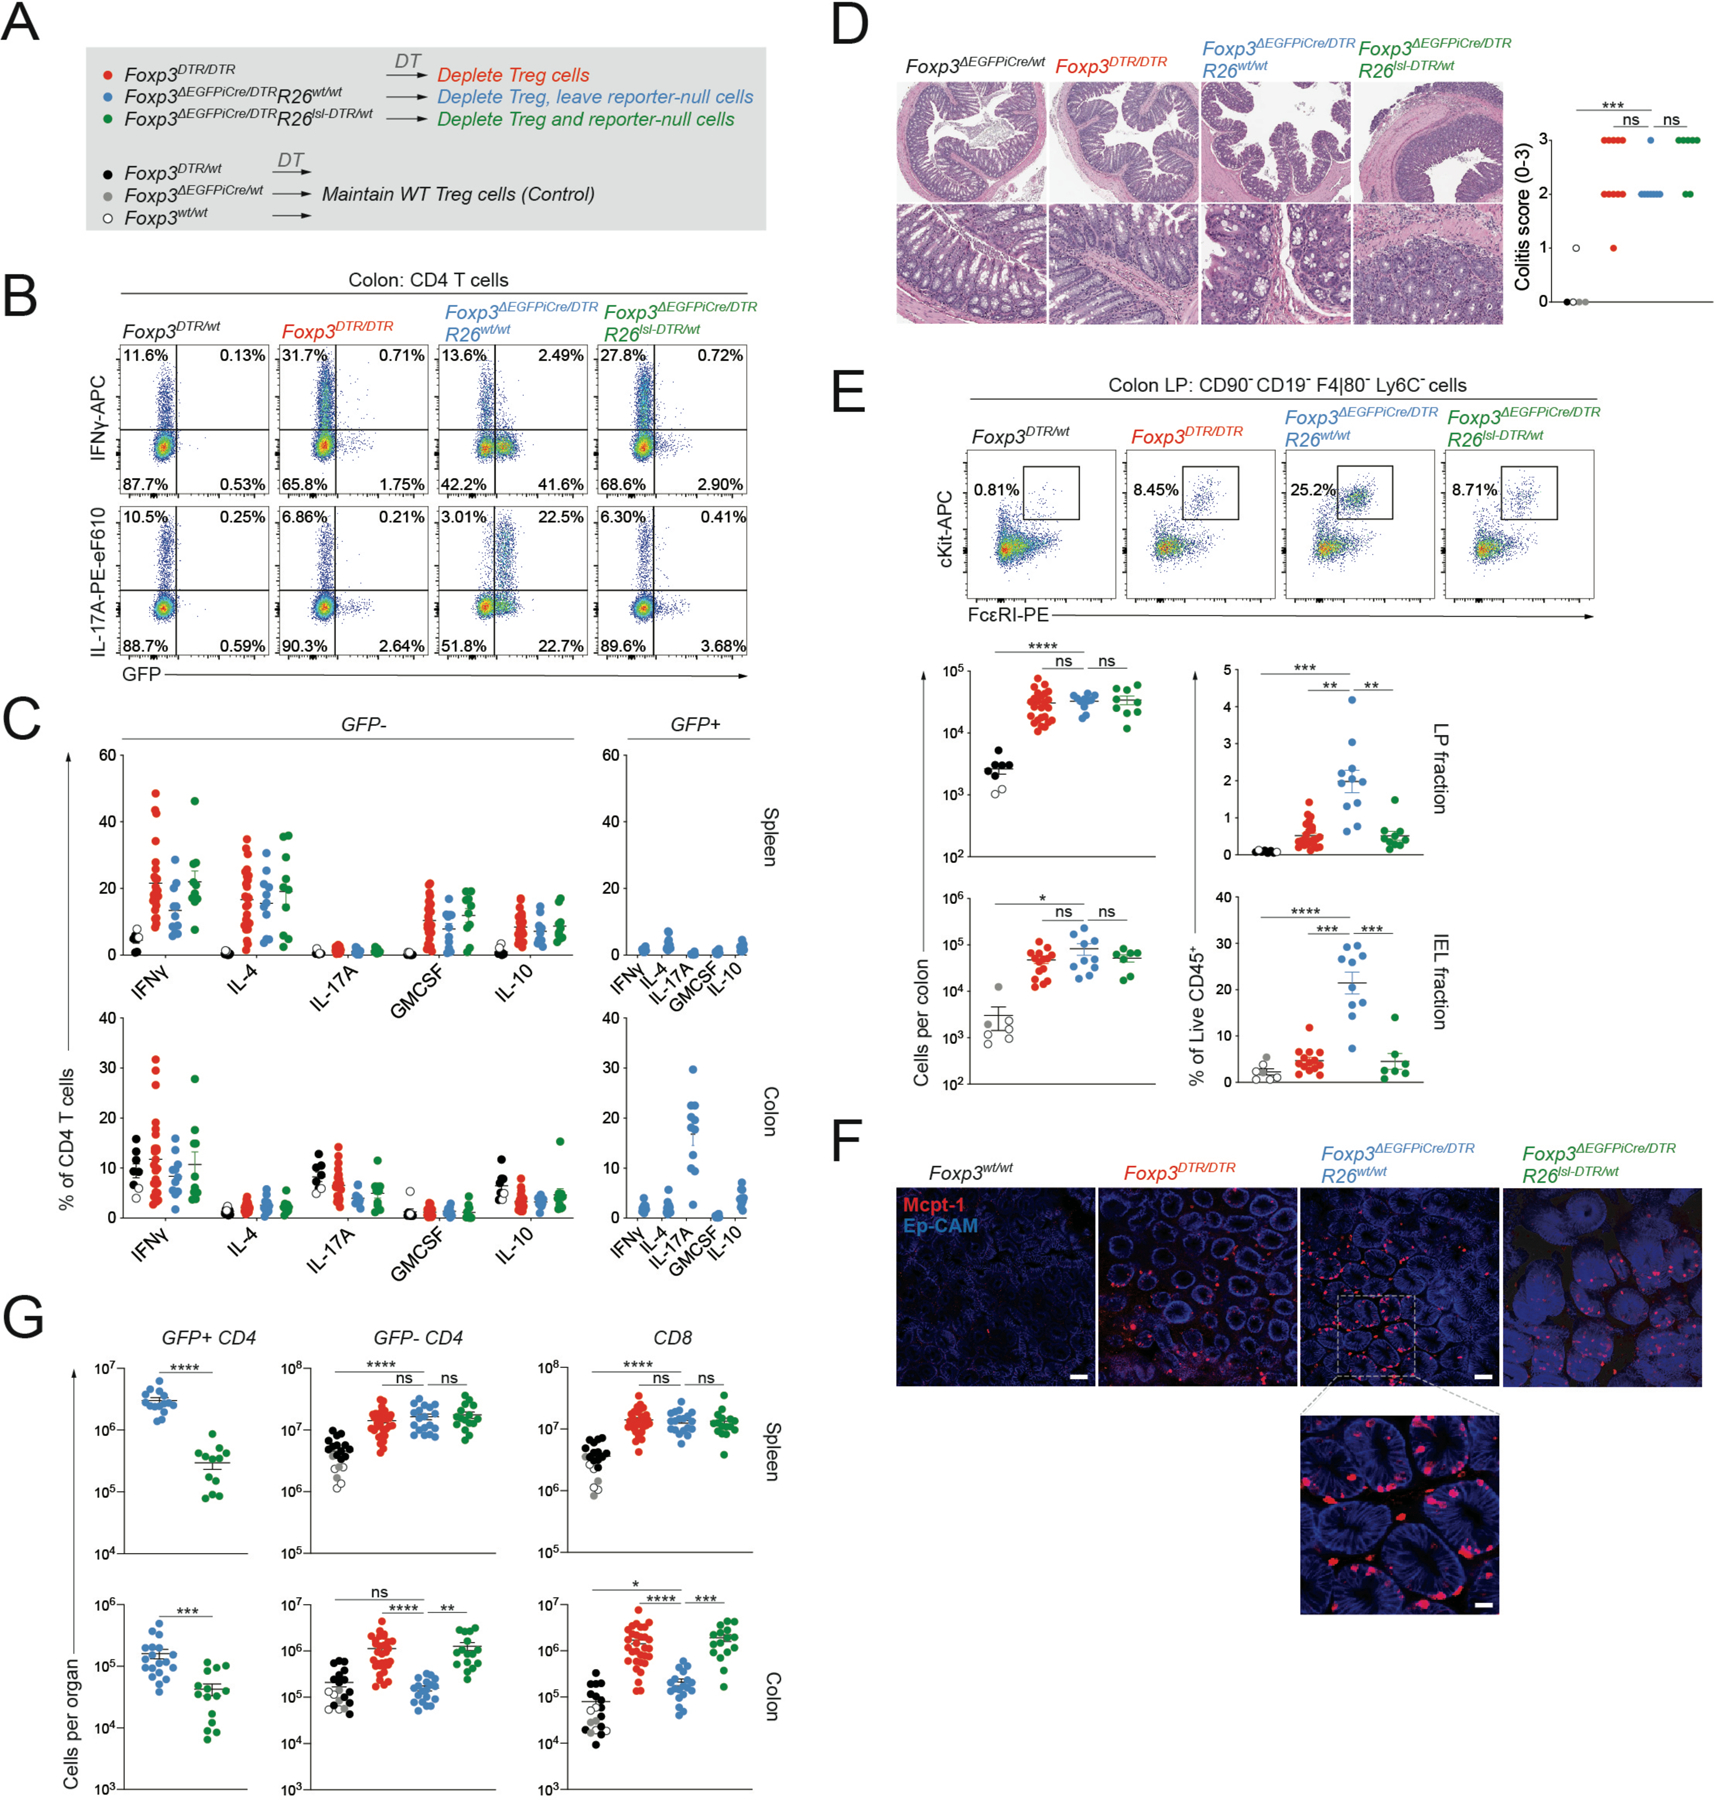
Figure 5: Colonic Treg cells have Foxp3-dependent and -independent suppressive functions.

A) Experimental design. Female mice of indicated genotypes were treated with DT (1μg via intraperitoneal injection on d0, d1, and d7) and analyzed two weeks after the start of treatment. B-C) Intracellular cytokine staining following 3-hour ex vivo re-stimulation. Pooled data from 4 experiments with n=8 to 25 mice per group. D: H&E staining of colonic sections from indicated genotypes and colitis scores (0–3). Pooled data from two independent experiments with n=5 to 11 mice per group. E: flow cytometry of mast cells in the colonic lamina propria (LP) and intraepithelial (IEL) fractions. Pooled data from 4 (LP) or 3 (IEL) independent experiments with n=8 to 25 mice per group (LP) or n=7 to 15 mice per group (IEL). F: Representative whole-mount immunofluorescence (IF) images of the proximal colon of mice of the indicated genotypes stained with anti-Mcpt1 (red) and anti-Ep-Cam (blue). Scale bars, 50μm. Scale bar of inset below, 10μm. G: Total CD4 and CD8 T cell counts in the spleen and colonic LP analyzed by flow cytometry. Pooled data from 8 experiments with n=16 to 31 mice per group. P-values from Brown-Forsythe and Welch ANOVA (*:p<0.05, **p<0.01, ***: p<0.001, ****: p<0.0001). See also Figure S5.
