
Fig. 1. scRNA-seq analysis of human acne lesions.
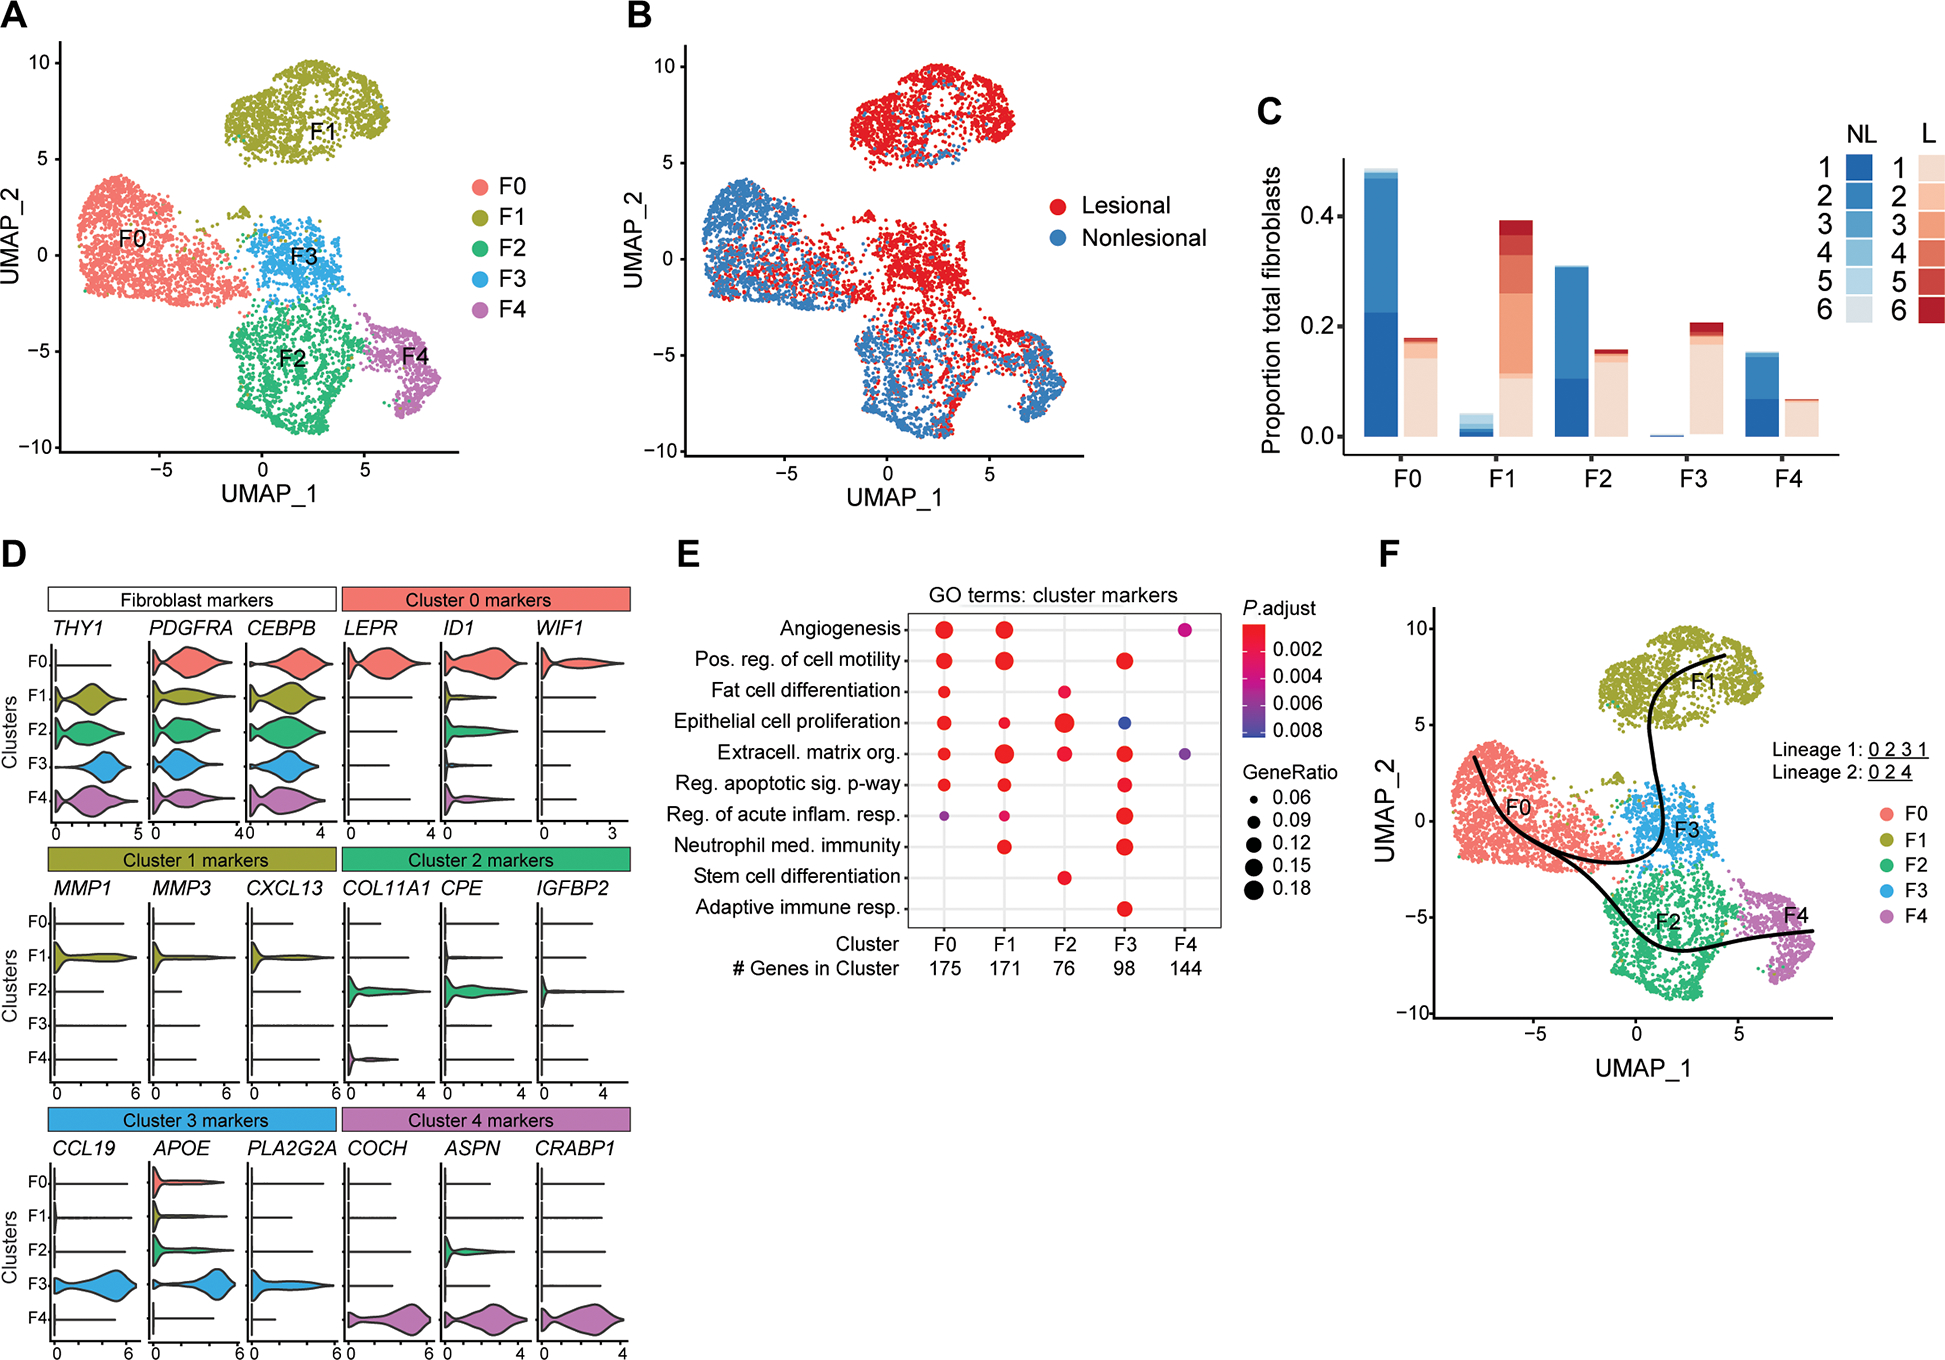
(A) UMAP plot of PDGFRA+ fibroblasts showing five distinct subtypes colored by cluster or (B) by disease association. (C) Stacked bar plot showing the donor and lesion type composition for each of the fibroblast cell types. Lesional cells (L) are shown in red, and nonlesional cells (NL) are shown in blue. (D) Violin plots of conserved pan-fibroblast marker gene expression and expression of major cluster markers for all five fibroblast subsets from the top three differentially expressed genes. (E) Dot plot of selected GO terms across all fibroblast subsets. Circle size corresponds to the proportion of markers annotated to a given term, while the fill color indicates the adjusted P value for the enrichment score. (F) Pseudotime analysis projected onto UMAP plot from (A). Curves represent inferred trajectories.