
Fig. 2. Reactive adipogenesis occurs in the perifollicular stroma of acne.
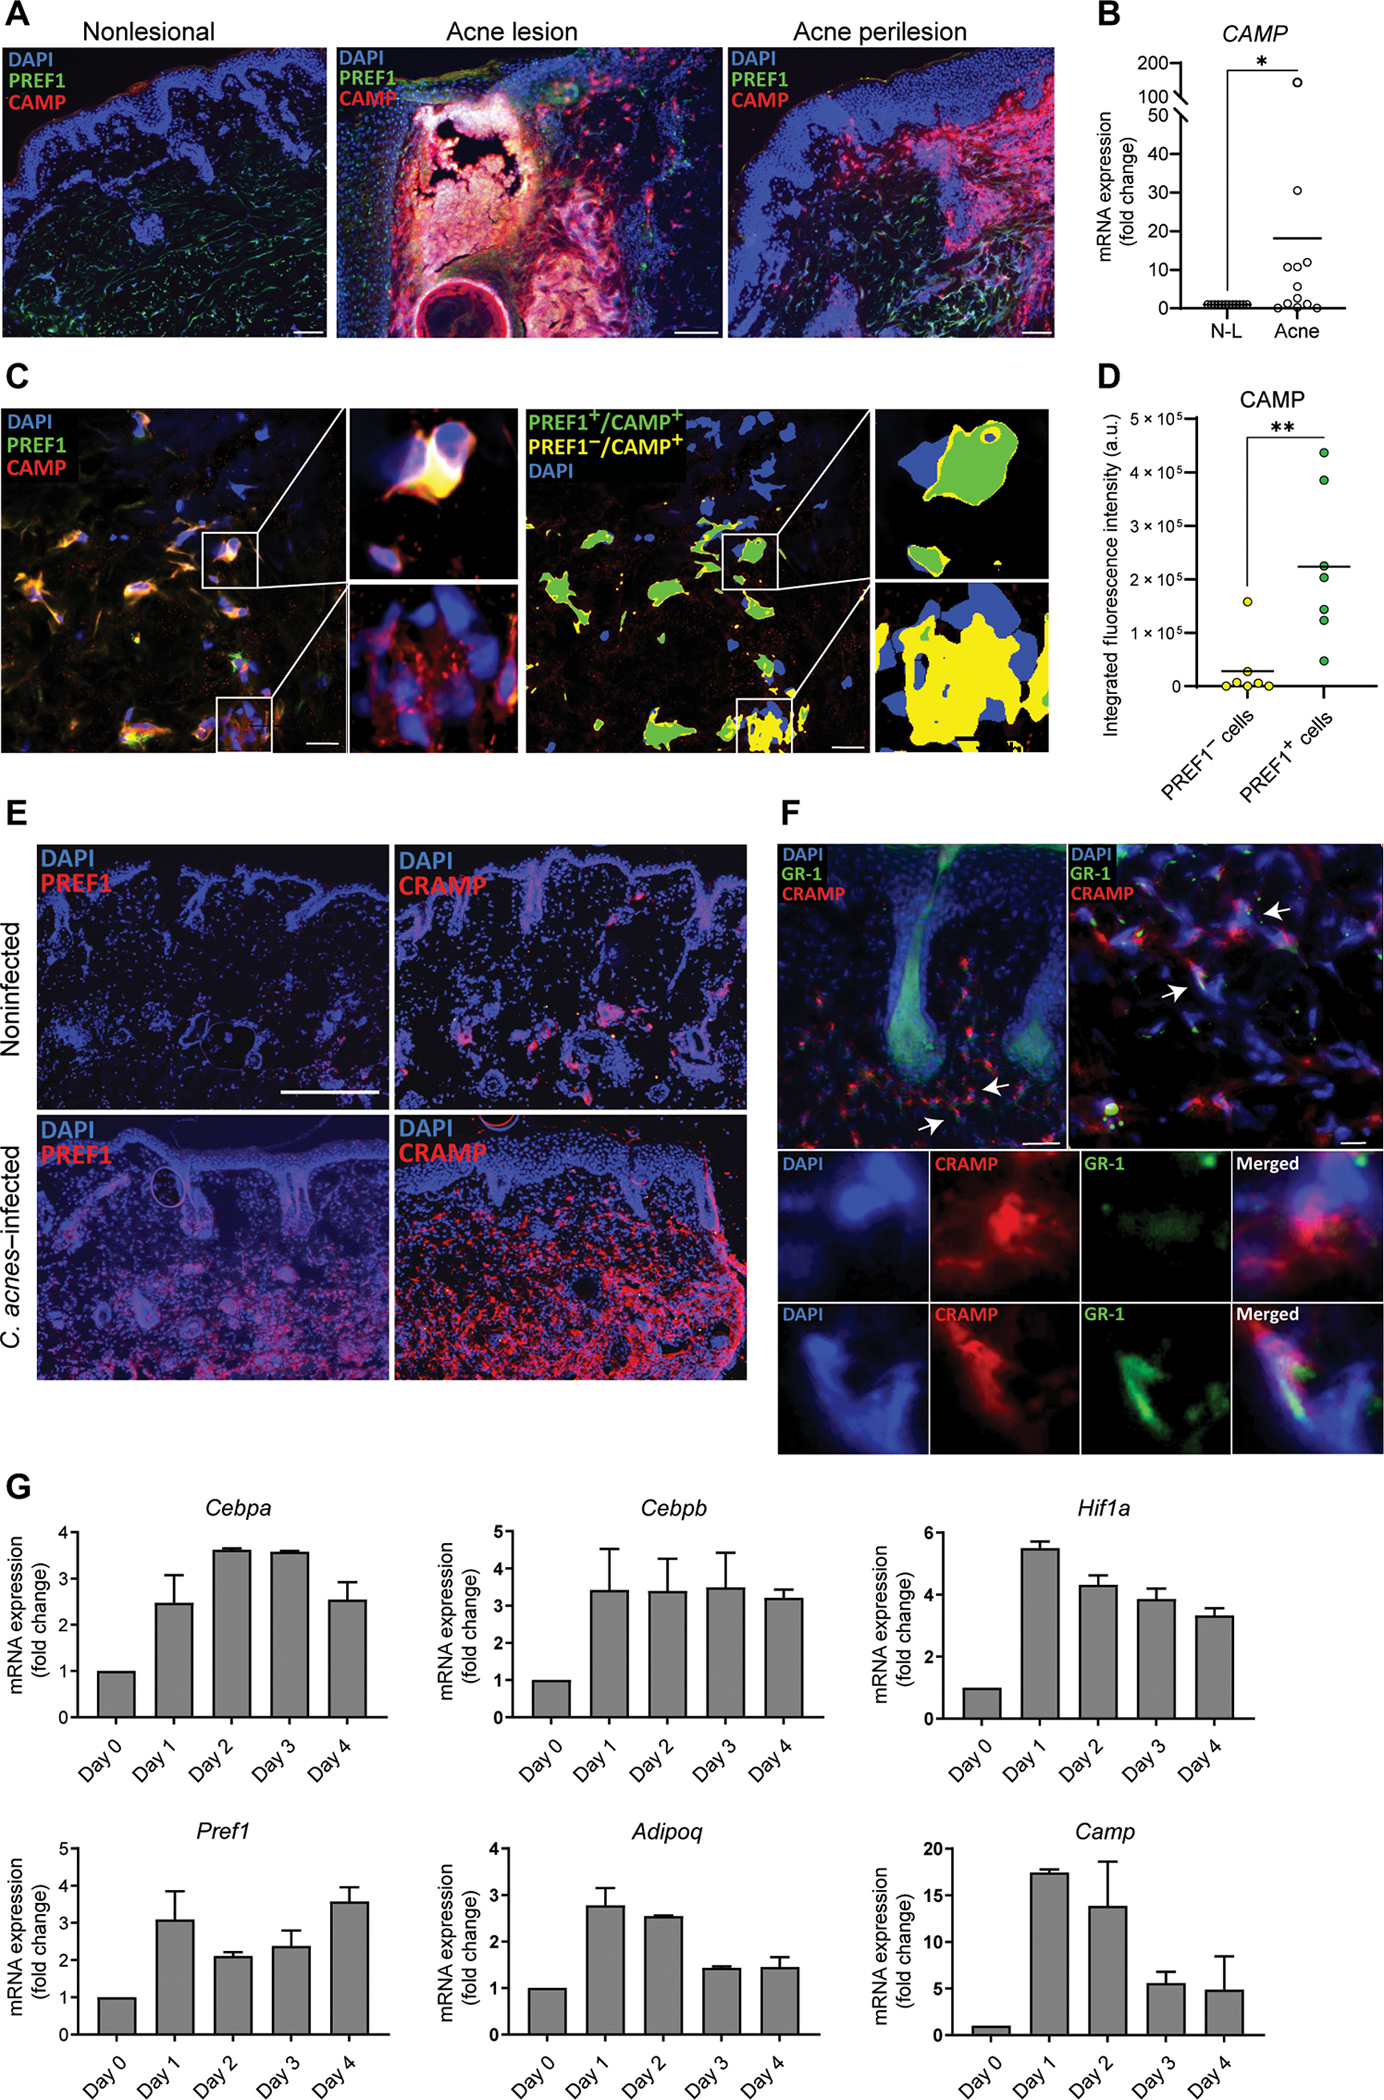
(A) Representative immunofluorescence images from biopsy sections of human acne lesional and nonlesional skin stained for LL-37 (red), PREF1 (green), and 4′,6-diamidino-2-phenylindole (DAPI) (blue). Scale bars, 100 μm for nonlesional and perilesion and 150 μm for lesional skin. (B) RNA was extracted from tissue sections of 12 biopsies of eight acne patients, and CAMP mRNA expression from acne was measured by qPCR and normalized to nonlesional (N-L) skin. (C) Representative confocal microscopy image of the perifollicular dermis of an acne lesion stained for cathelicidin protein (CAMP), PREF1, and DAPI, with higher magnification images provided from the boxed areas. Right panel shows the same representative image after thresholding, with green indicating areas where CAMP and PREF1 overlap and yellow color indicating areas where CAMP does not overlap with PREF1. (D) Quantification of the integrated fluorescence intensity of CAMP in overlapping and nonoverlapping PREF1-positive cells. Each spot represents a 212 μm × 212 μm perifollicular image from the dermis of acne lesions sampled from two patients. a.u., arbitrary units. (E) Representative immunofluorescence images of CAMP and PREF1 staining from skin biopsies of SKH-1 mice that were intradermally infected with C. acnes or noninfected after 7 days. (F) Representative immunofluorescence images of CRAMP, GR-1, and DAPI in the perifollicular area of SKH-1 mouse skin infected with C. acnes. White arrows indicate examples of CAMP-expressing cells that are positive or negative for GR-1 expression, with corresponding higher magnification images provided in the lower panel. Scale bar, 100 μm. (G) C. acnes–infected and noninfected SKH-1 mouse skin biopsies were collected on indicated days, and mRNA expression of the indicated genes was analyzed by qPCR with values shown relative to Gapdh control and normalized to noninfected (day 0) skin. n = 3 mice per condition. Data are means ± SEM. *P < 0.05 and **P < 0.01, two-tailed paired Student’s t test.