
Fig. 5. RA inhibits adipogenesis and enhances cathelicidin in response to C. acnes infection.
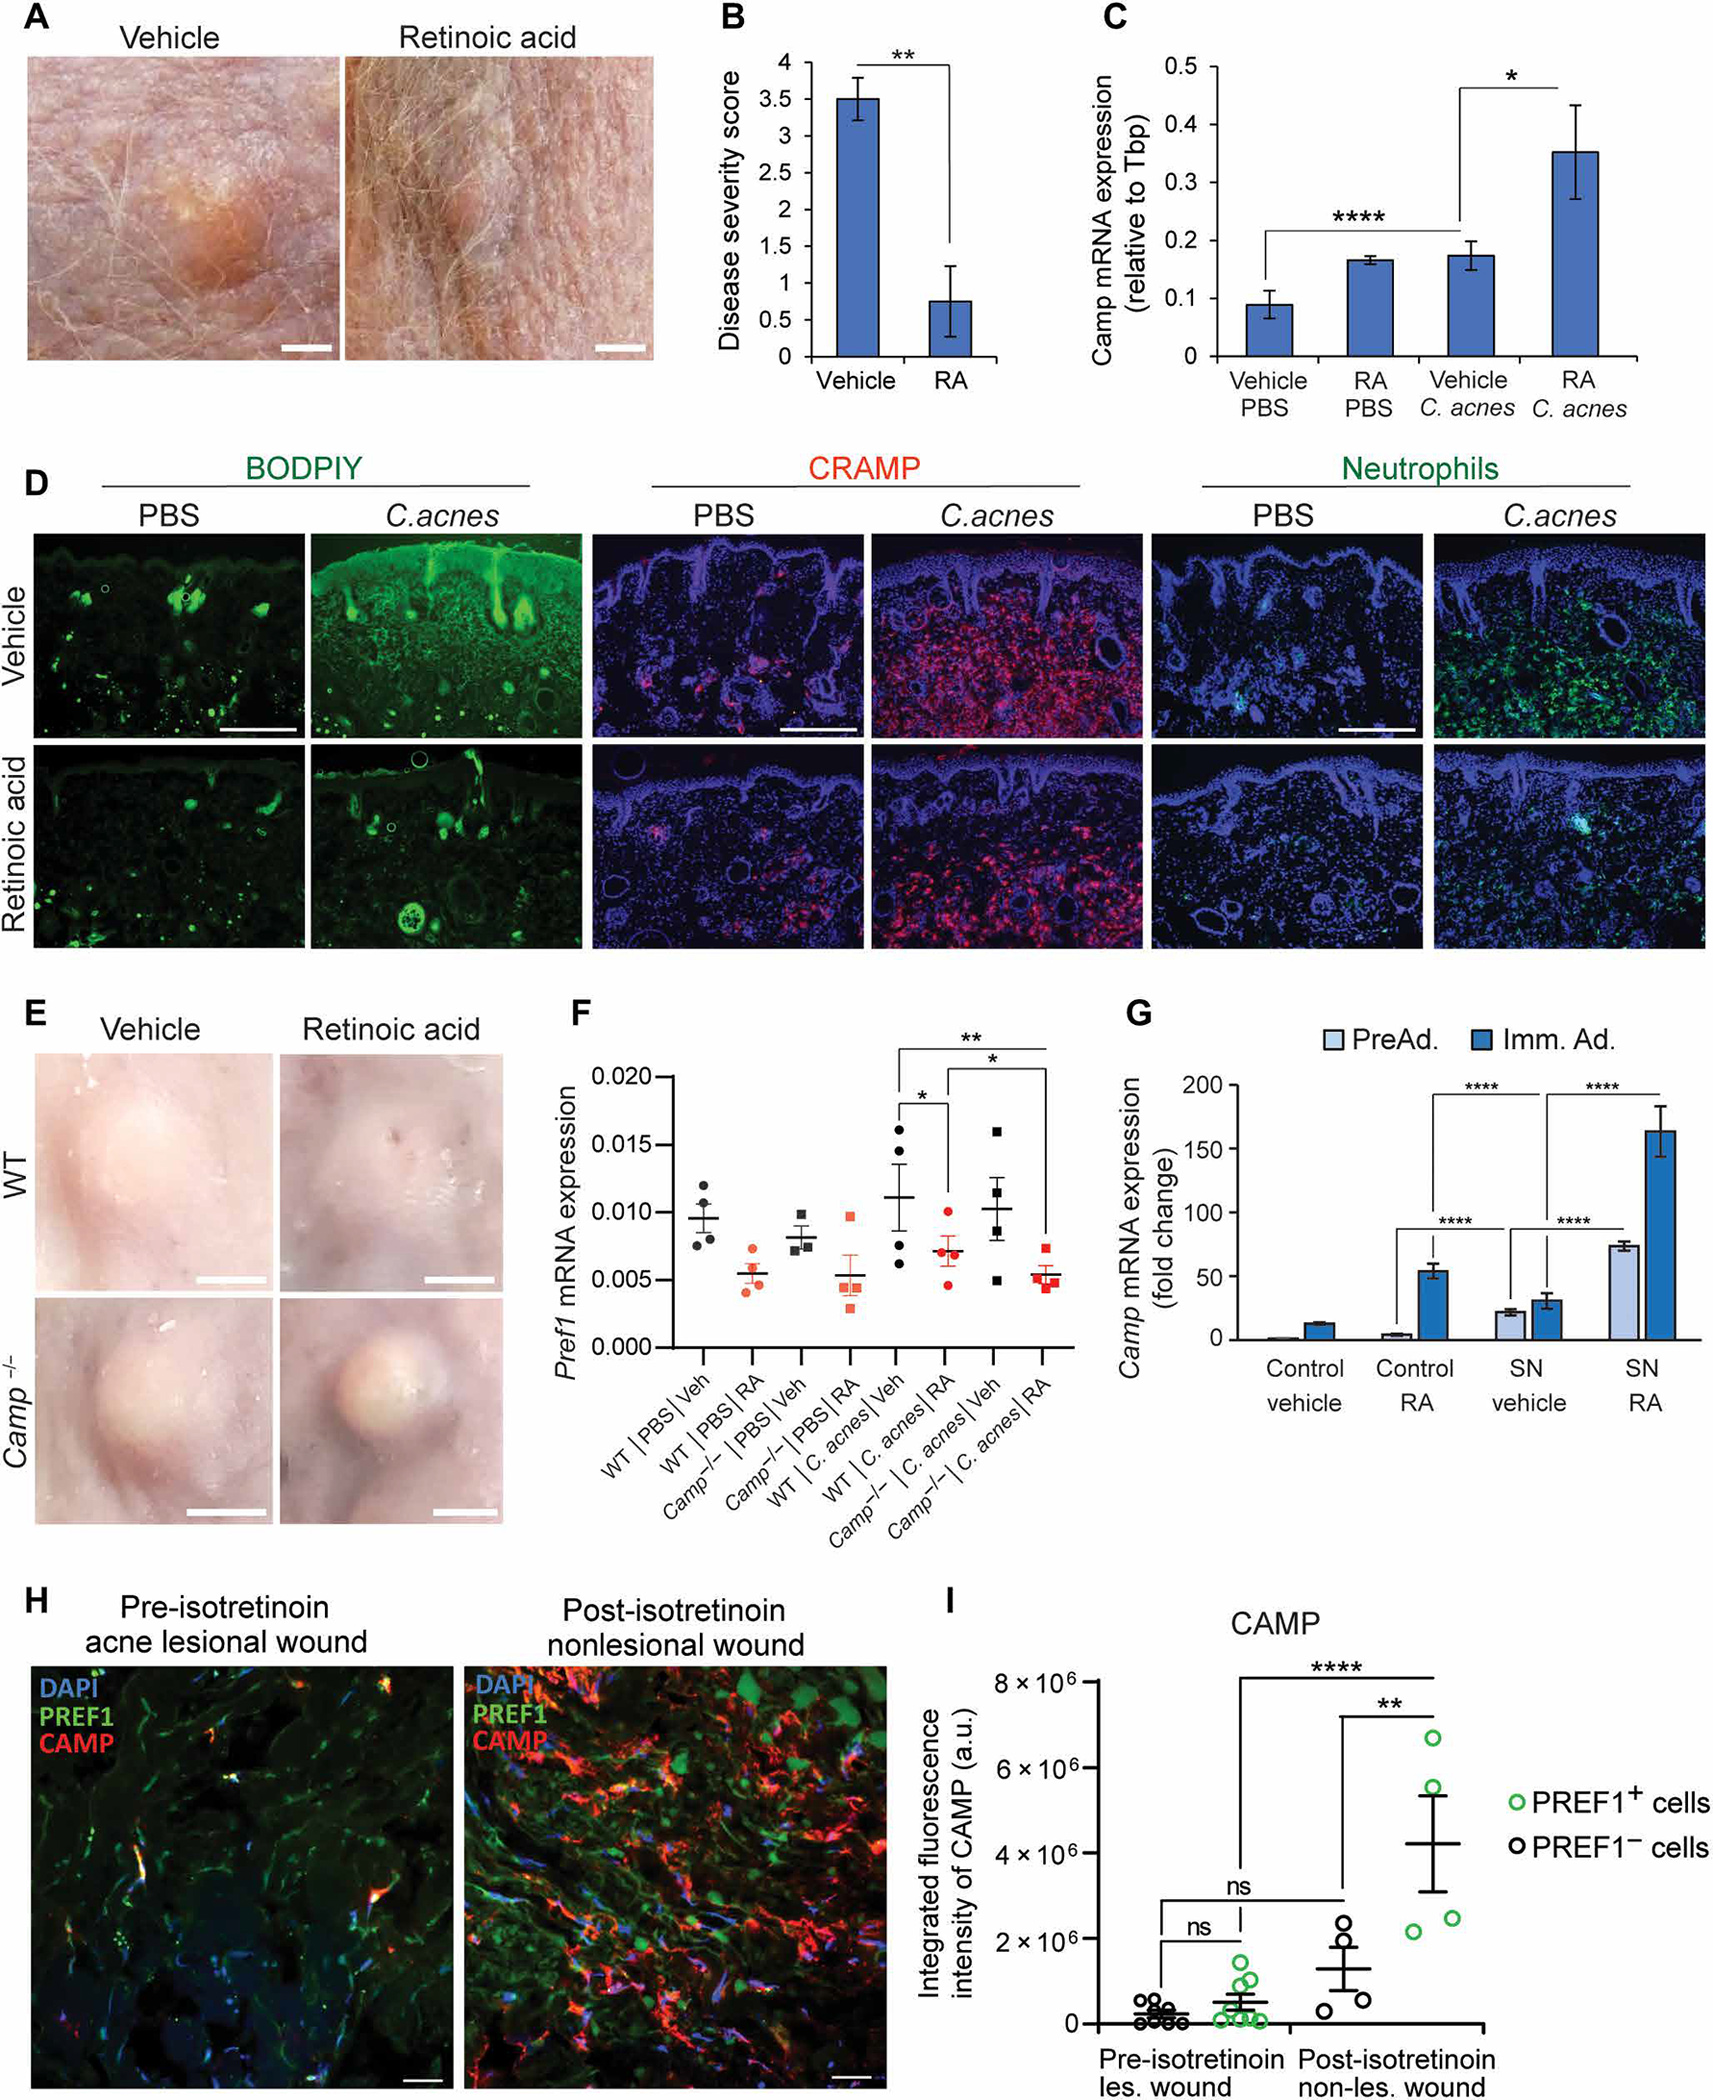
SKH-1 mice were intradermally infected with C. acnes on day 0. Starting on day 3, mice were injected subcutaneously at a distal site with retinoic acid (RA) or olive oil (control) for 3 days (n = 4 per group). On day 6, skin was collected for analysis. (A) Representative day 6 images of acne-like lesions in mice treated with vehicle (left) or RA (right). Scale bar, 2 mm. (B) Disease severity score of C. acnes–infected lesions (n = 4) by investigator assessment of lesion severity ranging from 0 (no lesion detected) to 4 (most severe). (C) Camp mRNA expression in C. acnes–infected or mock PBS–infected mouse skin treated with RA or vehicle control (n = 4 mice). (D) Fluorescent microscopy images of C. acnes–infected and mock PBS–infected mouse skin (n = 4), showing representative staining of total skin lipids (BODIPY dye, green), or immunolabeling of CRAMP (red) or neutrophils (anti–GR-1, green) for each treatment group (RA versus vehicle, n = 4 sections). All sections were counterstained with DAPI. Scale bar, 300 μm. (E and F) WT or Camp−/− C57BL/6 mice were intradermally infected with C. acnes and treated identically to SKH-1 mice listed above, and findings were assayed on day 6. (E) Representative day 6 images of acne-like lesions from WT and Camp−/− mice treated with vehicle (oil) or RA after injection with PBS control or infected with C. acnes (representative of 8 lesions, n = 4 mice per group, n = 2 lesions per mouse). Scale bar, 2 mm. (F) C. acnes lesions and control skin were collected on day 6, and mRNA was measured by qPCR for expression of Pref1. (G) 3T3-L1 preadipocytes were cultured as nondifferentiated preadipocytes (PreAd.) or differentiated into immature adipocytes (Imm. Ad.) and stimulated with 2.5% C. acnes SN or RCM control with or without 1 μM RA or vehicle (ethanol) controls for 24 hours, and the relative mRNA expression of Camp was assessed by qPCR. (H) Representative confocal images of dermal preadipocytes in 24-hour wounds from acne patients before and after isotretinoin therapy. Sections were stained for PREF1, CAMP, and DAPI, and thresholding was conducted on regions of CAMP staining with overlap of PREF1 and regions of CAMP staining without overlap of PREF1. Scale bar, 20 μm. (I) Quantification of the integrated fluorescence intensity of CAMP in PREF1-positive cells and PREF1-negative cells before and after isotretinoin treatment. Each spot represents a 212 μm × 212 μm perifollicular dermal image from acne sections from two acne patients. Data are means ± SEM. *P < 0.05, **P < 0.01, ***P < 0.001, and ****P < 0.0001 using Student’s paired t test. Data in (I) represent means ± SEM with ordinary one-way ANOVA with Tukey’s multiple comparisons test.