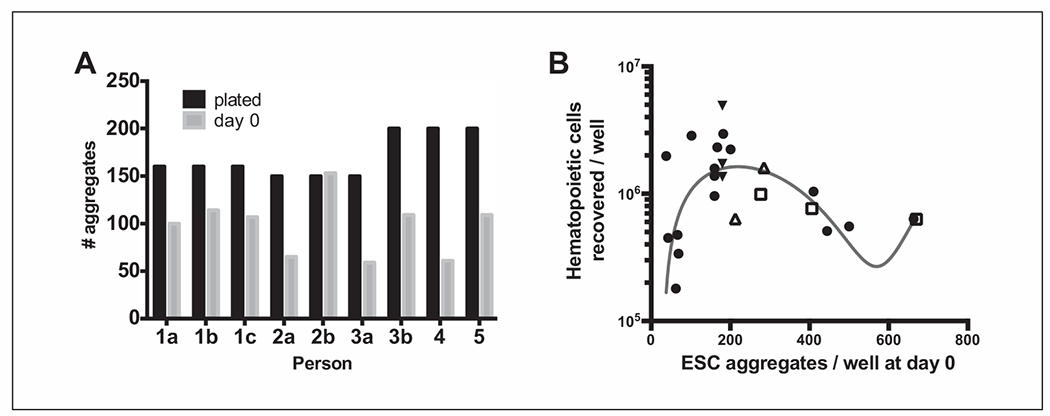
Figure 3.

Aggregate plating variations (between batches and users) and impact on HPC yield. (A) A trial experiment using matched-passage WA01 aggregates (passaged by one user) that were then split and plated as if for differentiation by five different users. Three users (1, 2, 3) repeated this experiment with 1 to 2 additional batches of WA01 cells at different passages (replicates b and c). Aggregate counts are shown for the intended plating density (plated, black bars) and the number of aggregates present on the following day (day 0, gray bars). (B) Cumulative data from one user (after initial trial batches to gain experience) with multiple differentiation experiments using WA01 cells showing the relationship between plating density (aggregates per well at day 0) and the total number of HPCs recovered at 12 days post-differentiation (per well). WA01 cells from passage 29 to passage 39 were used for all experiments and were all maintained and differentiated by one user. Trend assessment (blue line) was determined by a third-order nonlinear polynomial curve fit using GraphPad Prism 9. Filled round symbols indicate individual differentiation experiments, different days, and different passages of cells. Open symbols indicate matched-passage cells intentionally plated at different densities (open triangle, p31; open square, p30). Filled triangles indicate different-passage cells all plated on the same day at the same density.
