
Figure 5.
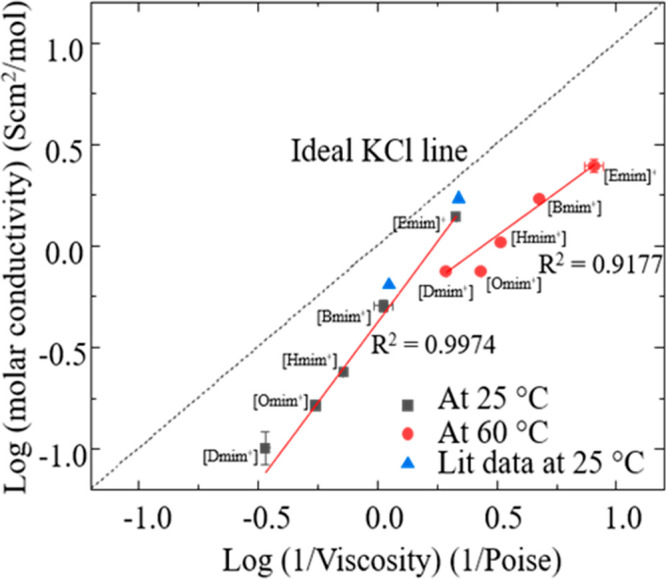
Log–Log plot of molar conductivity vs viscosity (Walden plot) indicates the degree of ionicity of the IL. The plots are drawn using the data collected at 25 and 60 °C and are compared to the “ideal” case of 0.1 M KCl, which exists as dissociated ions. Error propagation is performed for x and y errors and plotted in the same plot as logarithmic errors.