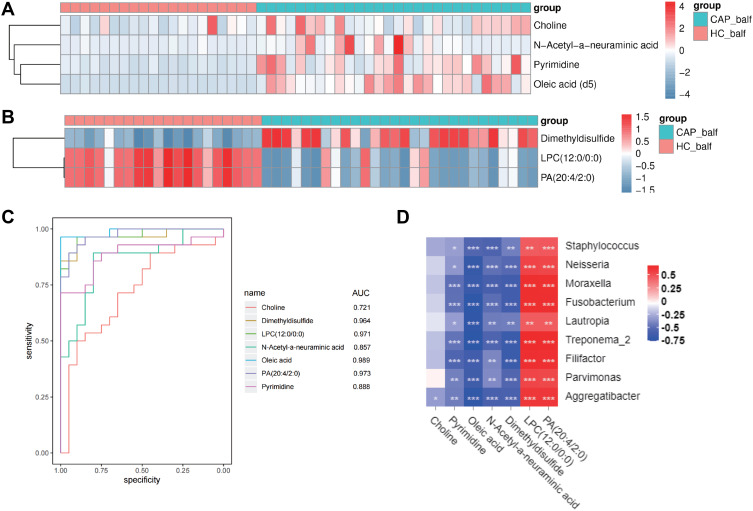
Figure 7.
Identification and evaluation of the potential biomarkers.
Notes: (A) Heatmap of the differential metabolites detected in the negative ion mode; (B) Heatmap of the differential metabolites in the positive ion mode; and (C) ROC curves of the 7 potential biomarkers; (D) Association between differences in the host metabolites and components of the LRT microbiome, for CAP cases compared to controls (*p<0.05, **p<0.01, ***p<0.001). Red refers to a positive correlation and blue to a negative correlation.

