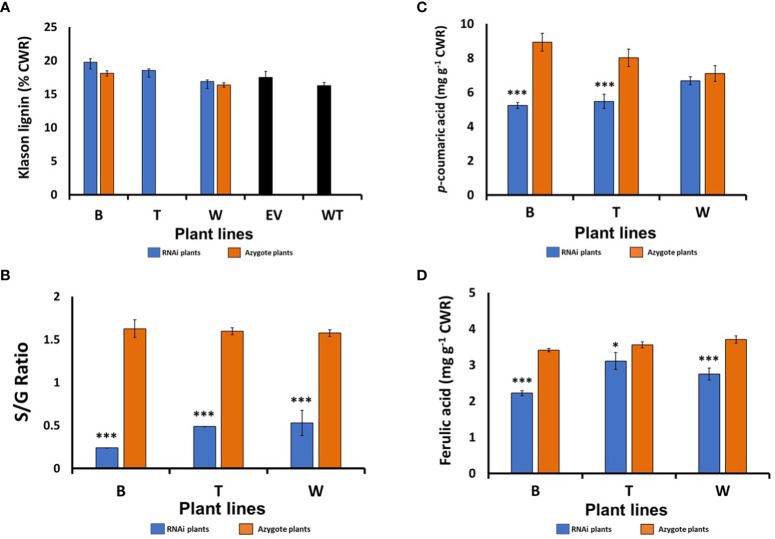
Figure 2.
Cell wall compositional analysis of the senesced barley straw from the T2 generation HvF5H1-RNAi lines and controls: (A) Klason lignin content, (B) S/G ratio, (C) Ester-linked p‐coumaric acid (pCA), (D) ester-linked ferulic acid (FA), as measured by mild alkaline hydrolysis. Lines marked with * & *** are significantly different from their controls which were the respective azygote plants in the case of lines B and W; for line T where no azygous controls were available, comparisons were made with empty vector (EV) plants for Klason lignin or with all azygote plants for S/G ratio and ester-linked pCA and FA, Student’s t‐test P<0.05 and P<0.001, respectively for * and ***. The error bars represent standard errors between 3-7 biological replicates (i.e. independent plants). B, T, and W; RNAi lines; EV: Empty vector; WT: wild type.

