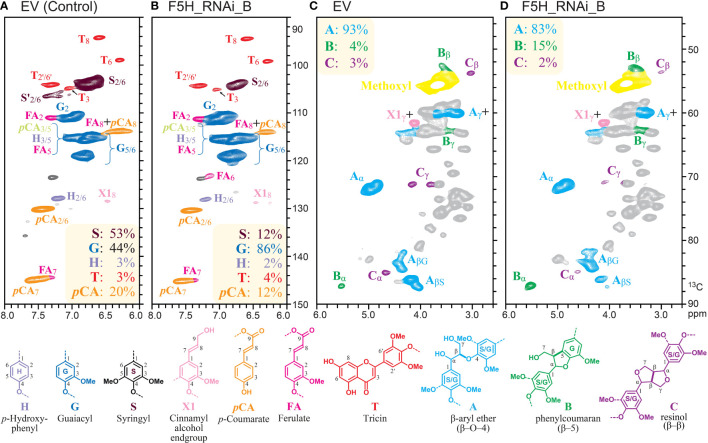
Figure 3.
Aromatic and aliphatic subregions of 2D-NMR (HSQC) spectra of stem cell walls from HvF5H1-RNAi plants (T2 generation) and EV. Summary data in the boxes color-coded to match their respective assignments, and represent percentages of; (A, B) major lignin subunits to the total amount of H, G, and S units; and (C, D) characterised inter-monomeric bonds to the total number of the lignin interunit linkages.

