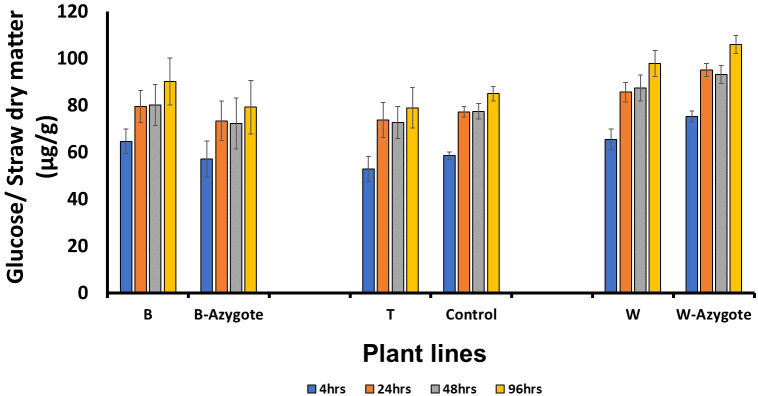
Figure 5.
Saccharification following hot water pretreatment. No significant differences (P < 0.05) were identified following Student’s t‐test. B, T, W are RNAi lines; B-azygote, W-azygote are corresponding azygote lines; for line T where no azygotes were available, empty vector and wild type plants were used as controls. The error bars represent standard errors between biological triplicates (i.e. independent plants).

