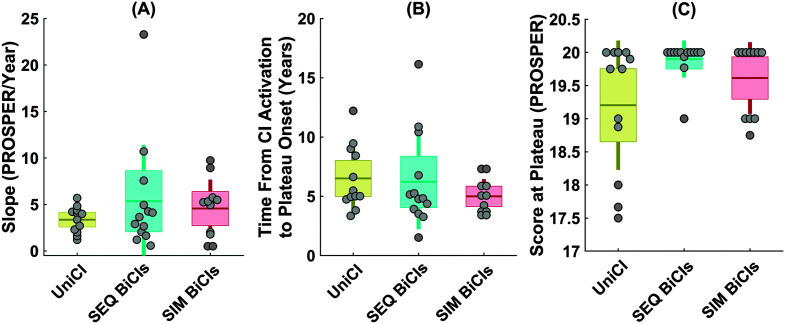
Figure 5.
Distribution of three outcome measures of (A) slope (PROSPER/year), (B) time from activation to the plateau onset, and (C) score at the plateau, calculated from the estimated speech recognition growth curves of the 36 first implanted ears for three groups of listening mode (UniCI, SEQ BiCIs, and SIM BiCIs). In each panel, a scatter plot shows the individual first implanted ears, while the boxplot summarizes the distribution of each outcome measure. The data points are laid over a ±1.96 standard error of the mean (95% confidence interval) shown as boxes and ±1 SD shown by vertical lines. The solid horizontal lines on the boxes show the mean for each group of data as a measure of central tendency. PROSPER = Pediatric Ranked Order Speech Perception; CI = cochlear implant; UniCI = unilateral cochlear implantation; SEQ BiCI = sequential bilateral implantation; SIM BiCIs = simultaneous bilateral implantation.

