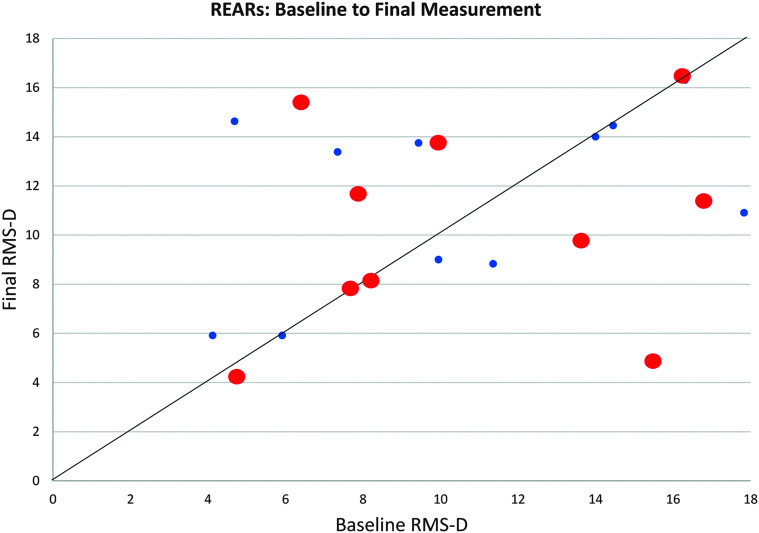
Figure 2.
Individual real-ear aided response (REAR) results for both right (bigger circles in red) and left (smaller circles in blue) ears (N = 10, 20 ears total) at baseline (x-axis) compared to final measurement (y-axis). The REARs compared to NAL-NL2 targets were compared by calculating the root-mean-square using the difference between the mean measured output at 500, 1000, 2000, and 4000 Hz and the NAL-NL2 targeted level across those frequencies (McCreery et al., 2013). There were seven fittings essentially unchanged from baseline to final measurement. There were seven fittings closer to target at baseline, and six fittings were adjusted over the intervention period leading to REARs closer to the prescriptive target. No significant differences were seen between baseline and final REARs. RMS-D = root-mean-square difference.

