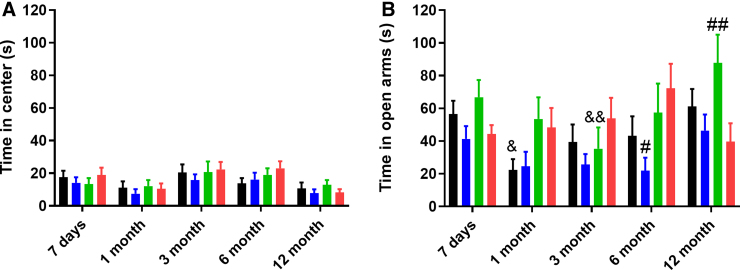
FIG. 2.
Anxiety-like phenotype as measured by time spent (s) in the (A) center of the open field and (B) open arms of the elevated plus maze. Graphs represent the mean ± SEM (&p < 0.05, &&p < 0.01 vs. 12-month time point; #p < 0.05, ##p < 0.01 compared to the msTBI group at that time point; n = 12–14 per group). msTBI, moderate-severe traumatic brain injury; SEM, standard error of the mean.

