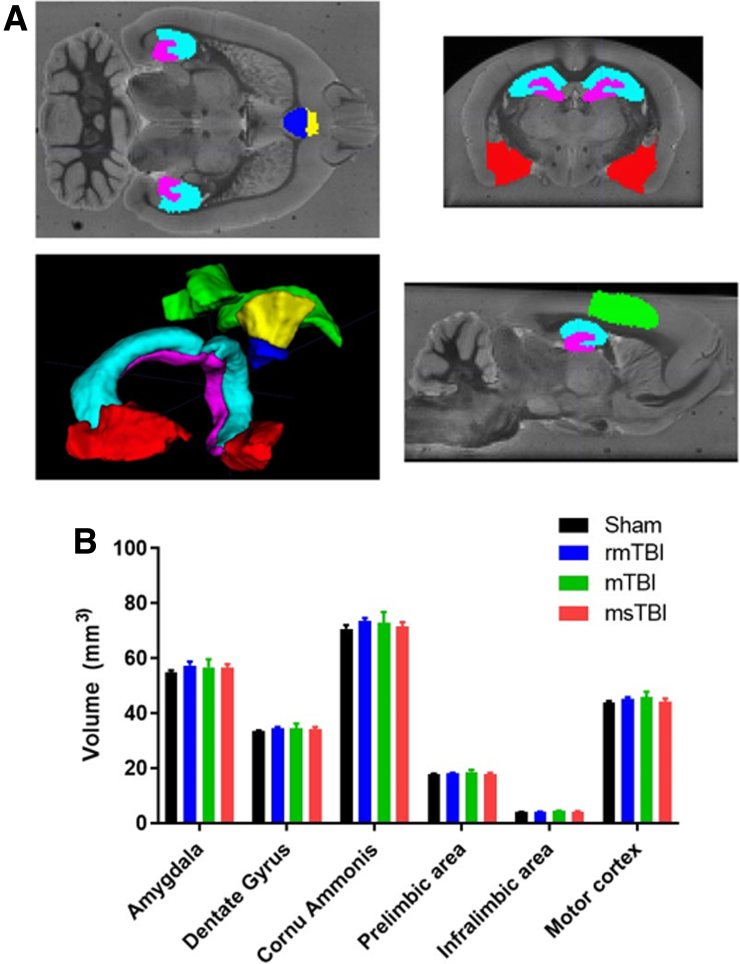
FIG. 4.
(A) Example image showing the WHS-defined regions registered to an example subject's bias field-corrected mean echo image, with volumetric rendering of the regions. Red = amygdala; magenta = dentate gyrus; cyan = cornu ammonis; yellow = pre-limbic area; blue = infralimbic area; and green = M1. (B) Analysis of volumetric data in the regions of interest showing no difference between injury groups at the 12-month time point. Graph represents the mean ± SEM (n = 6–8 per group). mTBI, mild traumatic brain injury; msTBI, moderate-severe traumatic brain injury; SEM, standard error of the mean; WHS, Waxholm Space.

