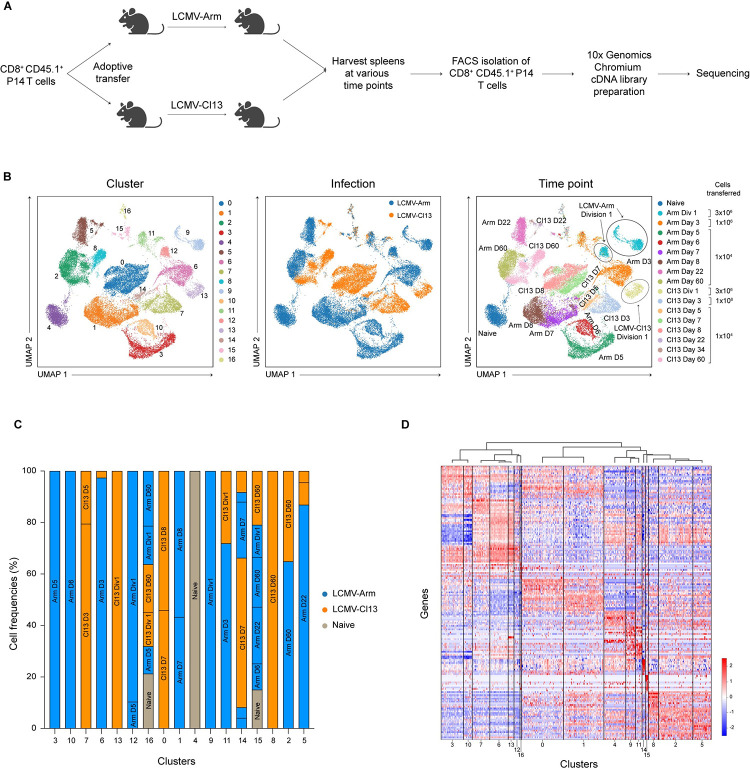
Fig 1. scRNA-seq analyses of CD8+ T cells responding to acute vs. chronic infection.
(A) Experimental setup. CD8+CD45.1+ P14 T cells were adoptively transferred into separate CD45.2+ hosts 1 day prior to infection with either LCMV-Arm or LCMV-Cl13. To identify cells that had undergone their first division, some cells were labeled with CFSE prior to adoptive transfer. Splenocytes were harvested at the indicated time points after infection. Donor P14 CD8+ T cells were FACS-isolated and processed for scRNA-seq using the 10x Genomics Chromium platform. (B) UMAP clustering of all CD8+ cells, colored by cluster identity (left), infection type (middle), or time point (right); the three Division 1 clusters are circled for emphasis. (C) Bar graphs indicating the infection type and time point from which cells derived from each cluster are derived; clusters are grouped according to similarity in gene expression based on (D). (D) Hierarchical clustering of clusters based on gene expression profiles. The raw data for the panels in this figure are located in S1 Data file. Fig 1A created with BioRender.com. CFSE, carboxyfluorescein succinimidyl ester; LCMV-Arm, LCMV-Armstrong; LCMV-Cl13, LCMV-Clone 13; scRNA-seq, single-cell RNA-sequencing; UMAP, Uniform Manifold Approximation and Projection.

