. 2023 Jan 17;12:e81032. doi: 10.7554/eLife.81032

Figure 1. Overview of the TRPM3 gene and location of the different variants.

(A) Exon-intron structure and alternative splicing of TRPM3. Percentages above colored exons indicate the percentage of transcripts that include the indicated exons in human cerebellar RNA-seq analyses. Exons included for numbering of the disease-associated variants are indicated in gray, blue, and green, resulting in the functional channel construct indicated in (B). Variant numbering was based on the amino acid position of the mutated residue in the NM_001366145.2 isoform. See text for more details.

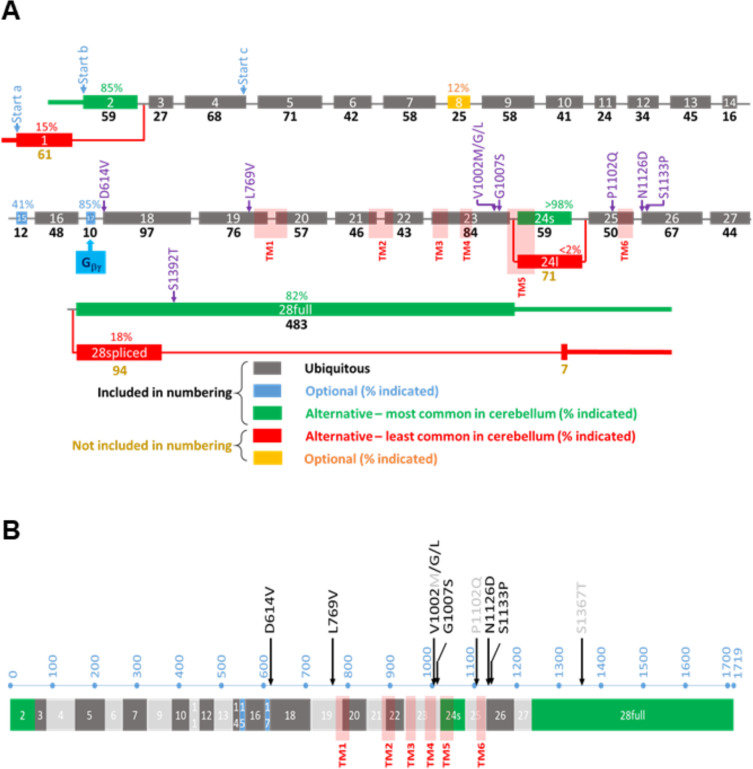
Figure 1.

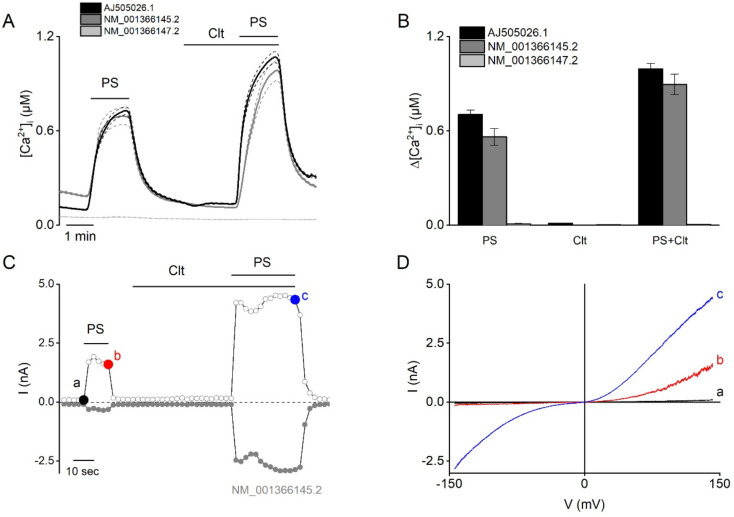
Figure 1—figure supplement 1. Functional characterization of different human TRPM3 constructs.

Figure 1—figure supplement 1.

(A–B) Three different variants of human TRPM3 (AJ505026.1 black, n=416 cells), NM_001366145.2 (dark gray, n=673), and NM_001366147.2 (light gray, n=644) were functionally characterized via Fura-2 fluorimetric experiments (N≥3 independent experiments). The TRPM3 agonist pregnenolone sulfate (PS; 40 µM) and clotrimazole (Clt; 10 µM) were applied at the indicated time periods. (B) Corresponding calcium amplitudes after stimulation by PS, Clt, and co-application of PS + Clt, represented as mean ± SEM. (C–D) NM_001366145.2 construct was further characterized via whole-cell patch-clamp experiments in HEK293T cells (N=5) after stimulation by PS (40 µM), Clt (10 µM), and co-application PS + Clt. (C) Time course of whole-cell patch clamp recording at holding of +150 mV (open circles) and –150 mV (closed circles) of HEK293T cells expressing the TRPM3 NM_001366145.2 construct. (D) Current-voltage relationship of time points indicated in panel (C).

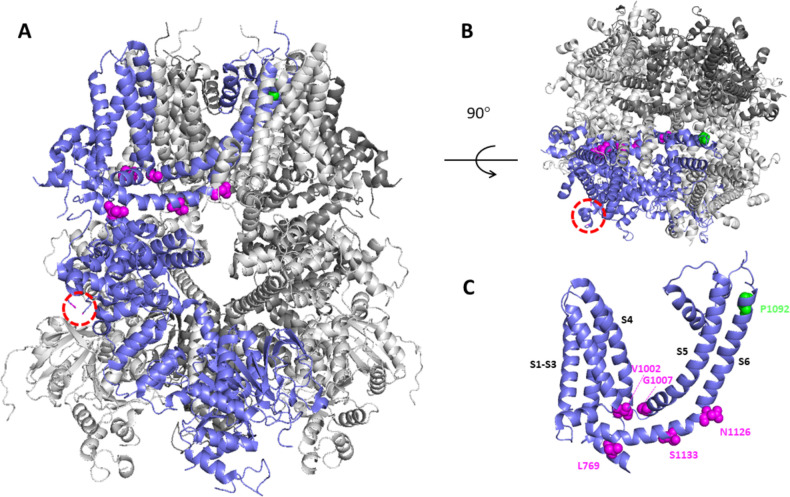
Figure 1—figure supplement 2. Structural model of TRPM3 based on the cryo-Electron Microscopy (EM) structure (pdb: 8DDQ).

Figure 1—figure supplement 2.

(A–B) Structural model of TRPM3, based on the cryo-EM structure (pdb: 8DDQ), seen from the side (A) and the top (B), indicating residues that are altered in the disease-associated variants. In one of the four subunits (blue), the red circled area indicates the location of the non-resolved loop where D694 is located, close to the interaction site of Gβγ. Other affected residues are indicated in magenta and green. (C) A cluster of disease-associated residues (magenta) is localized at the interface between transmembrane domain and cytosol, whereas P1092 is located at the extracellular part of transmembrane helix S6.

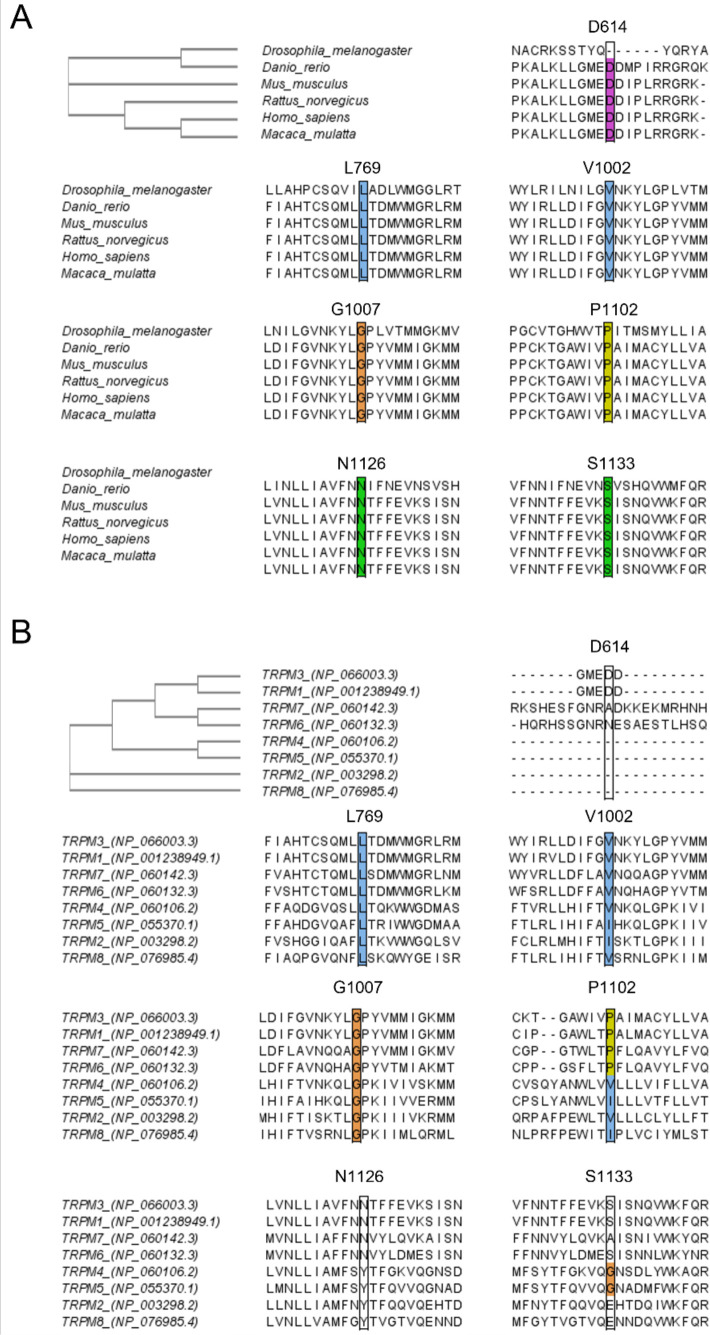
Figure 1—figure supplement 3. Sequence alignment of TRPM3 with different species and different members of the transient receptor potential (TRP) melastatin (M) family.

Figure 1—figure supplement 3.

CLUSTAL Omega (1.2.4) multiple sequence alignment was used to perform the alignment and to obtain the Phylogenetic Tree as shown on the left top. Sequence alignment at positions D614, L769, V1002, G1007, P1102, N1126, and S1133 is conserved across multiple species (A) and conserved across related members of the TRPM family (B).