. 2023 Jan 17;12:e81032. doi: 10.7554/eLife.81032

Figure 5. TRPM3 expression in the human cerebellum.

(A and B) Uniform Manifold Approximation and Projection (UMAP) visualization of human cerebellar nuclei annotated on the basis of marker genes for the developing (A) and adult cerebellum (B). (C and D) The same UMAP visualization of human cerebellar nuclei as panel (A) and (B), now representing the expression of TRPM3 for the developing (C) and adult cerebellum (D), respectively. (E and F) Dot plot showing the expression of one selected marker gene per cell type for the developing (E) and adult cerebellum (F). The size of the dot represents the percentage of nuclei within a cell type in which that marker was detected, and its color represents the average expression level. (G) Dot plot showing the expression of one selected marker gene per region of the rhombic lip (RL). Data set of TRPM3 in developing cerebellum adapted from Aldinger et al., 2021. Data set of TRPM3 in adult cerebellum adapted from Lake et al., 2018.

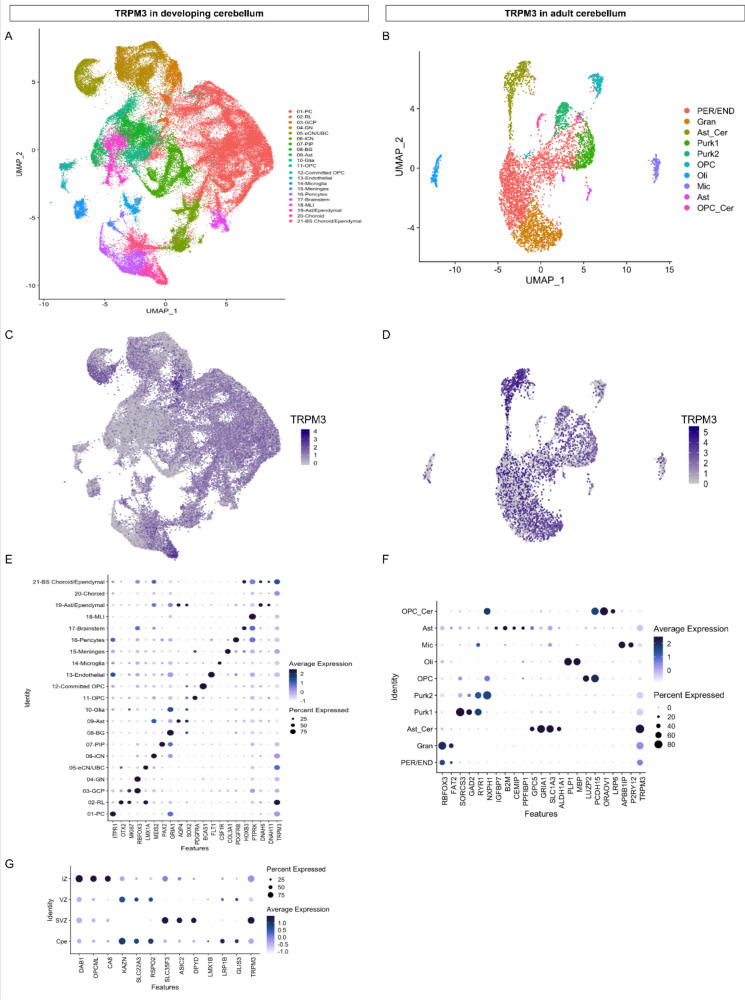
Figure 5.

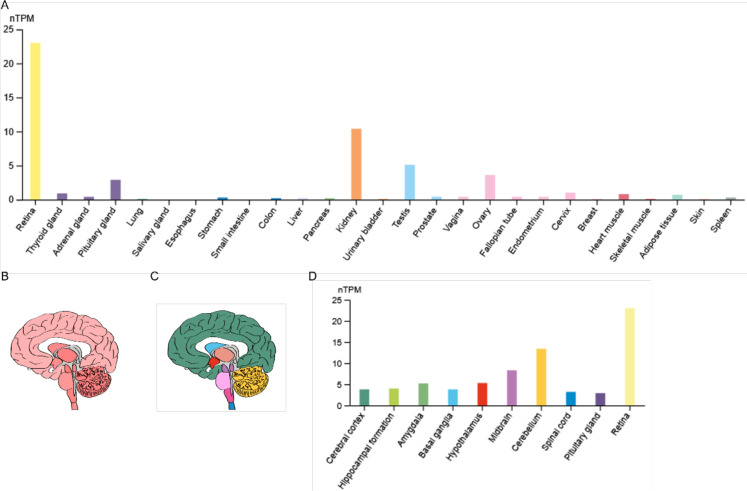
Figure 5—figure supplement 1. RNA expression of TRPM3 in humans.

Figure 5—figure supplement 1.

(A) RNA-seq tissue data generated by the Genotype-Tissue Expression (GTEx) project, reported as nTPM (normalized protein-coding transcripts per million), corresponding to mean values of the different individual samples from each tissue. (B) Illustration of human brain RNA expression levels, where darker color represents higher expression patterns. (C) Illustration of the human brain, where each color represents a different brain region. (D) GTEx human brain RNA-seq dataset reported as nTPM. Colors correspond to panel (C). Figures were adapted from the human protein atlas (https://www.proteinatlas.org/).

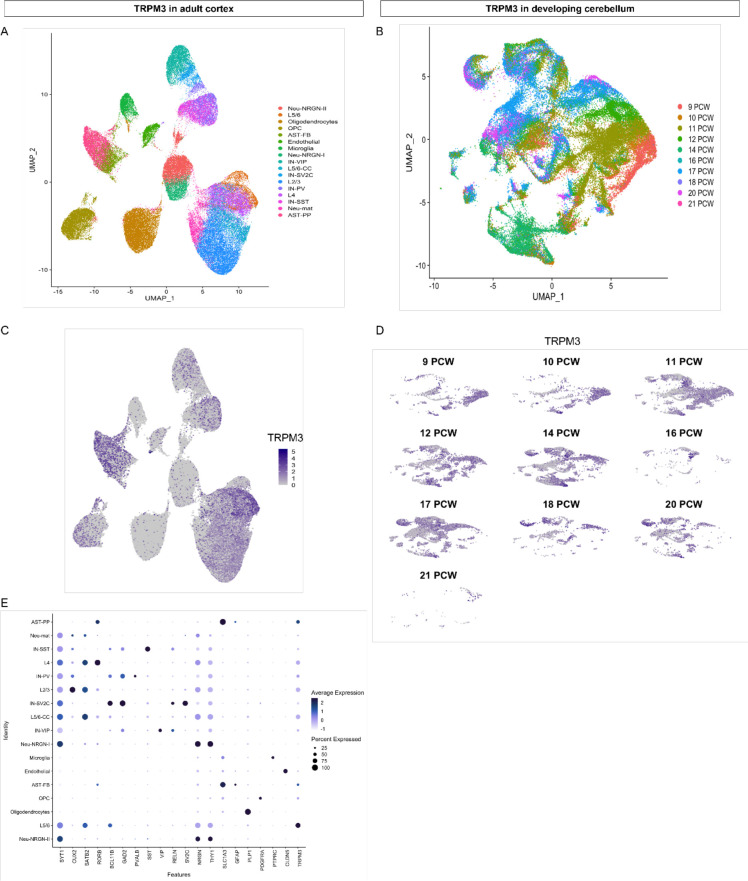
Figure 5—figure supplement 2. TRPM3 expression in adult cortex and developing cerebellum.

Figure 5—figure supplement 2.

(A) UMAP visualization of human cortical nuclei annotated on the basis of marker genes. (B) UMAP visualization of human developing cerebellar nuclei annotated on the basis of post conception weeks (PCW). (C and D) The same UMAP visualization of human nuclei as panel (A) and (B), now representing the expression of TRPM3 for the adult cortex (C) and developing cerebellum (D), respectively. (E) Dot plot showing the expression of one selected marker gene per cell type for the adult cortex. The size of the dot represents the percentage of nuclei within a cell type in which that marker was detected, and its color represents the average expression level. Data set of TRPM3 in adult cortex adapted from Velmeshev et al., 2019. Data set of TRPM3 in developing cerebellum adapted from Aldinger et al., 2021.