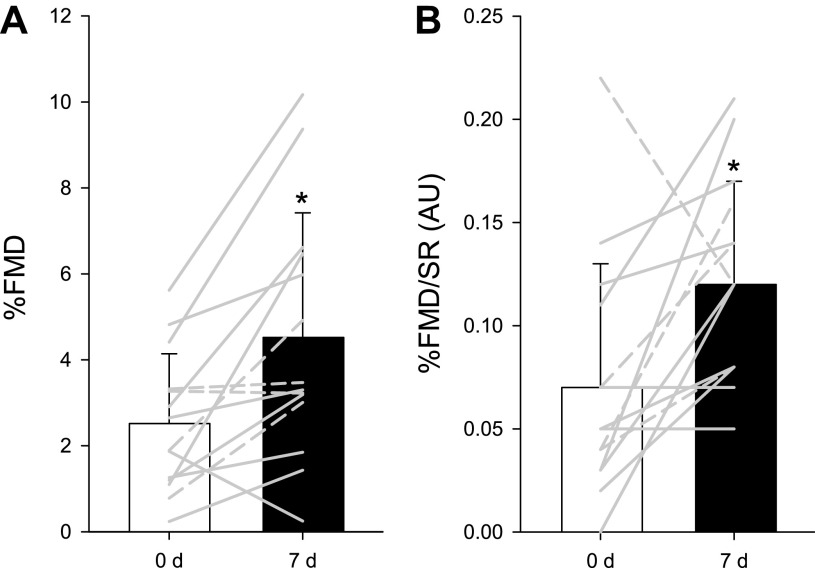
Figure 1.
A: brachial artery flow-mediated dilation (FMD) expressed as percent change before (white bar) and after (black bar) 7-day l-citrulline administration. Gray lines indicate individual responses in females (solid lines, n = 10) and males (dashed lines, n = 4). Values are presented as means ± SD. Paired Student’s t test was performed. *Significant difference between 0 and 7 days, P = 0.003. B: brachial artery FMD normalized for shear rate (SR) area-under-the-curve before (white bar) and after (black bar) 7-day l-citrulline administration. Gray lines indicate individual responses in females (solid lines, n = 10) and males (dashed lines, n = 4). Values are presented as means ± SD. Paired Student’s t test was performed. *Significant difference between 0 and 7 days, P = 0.012.

