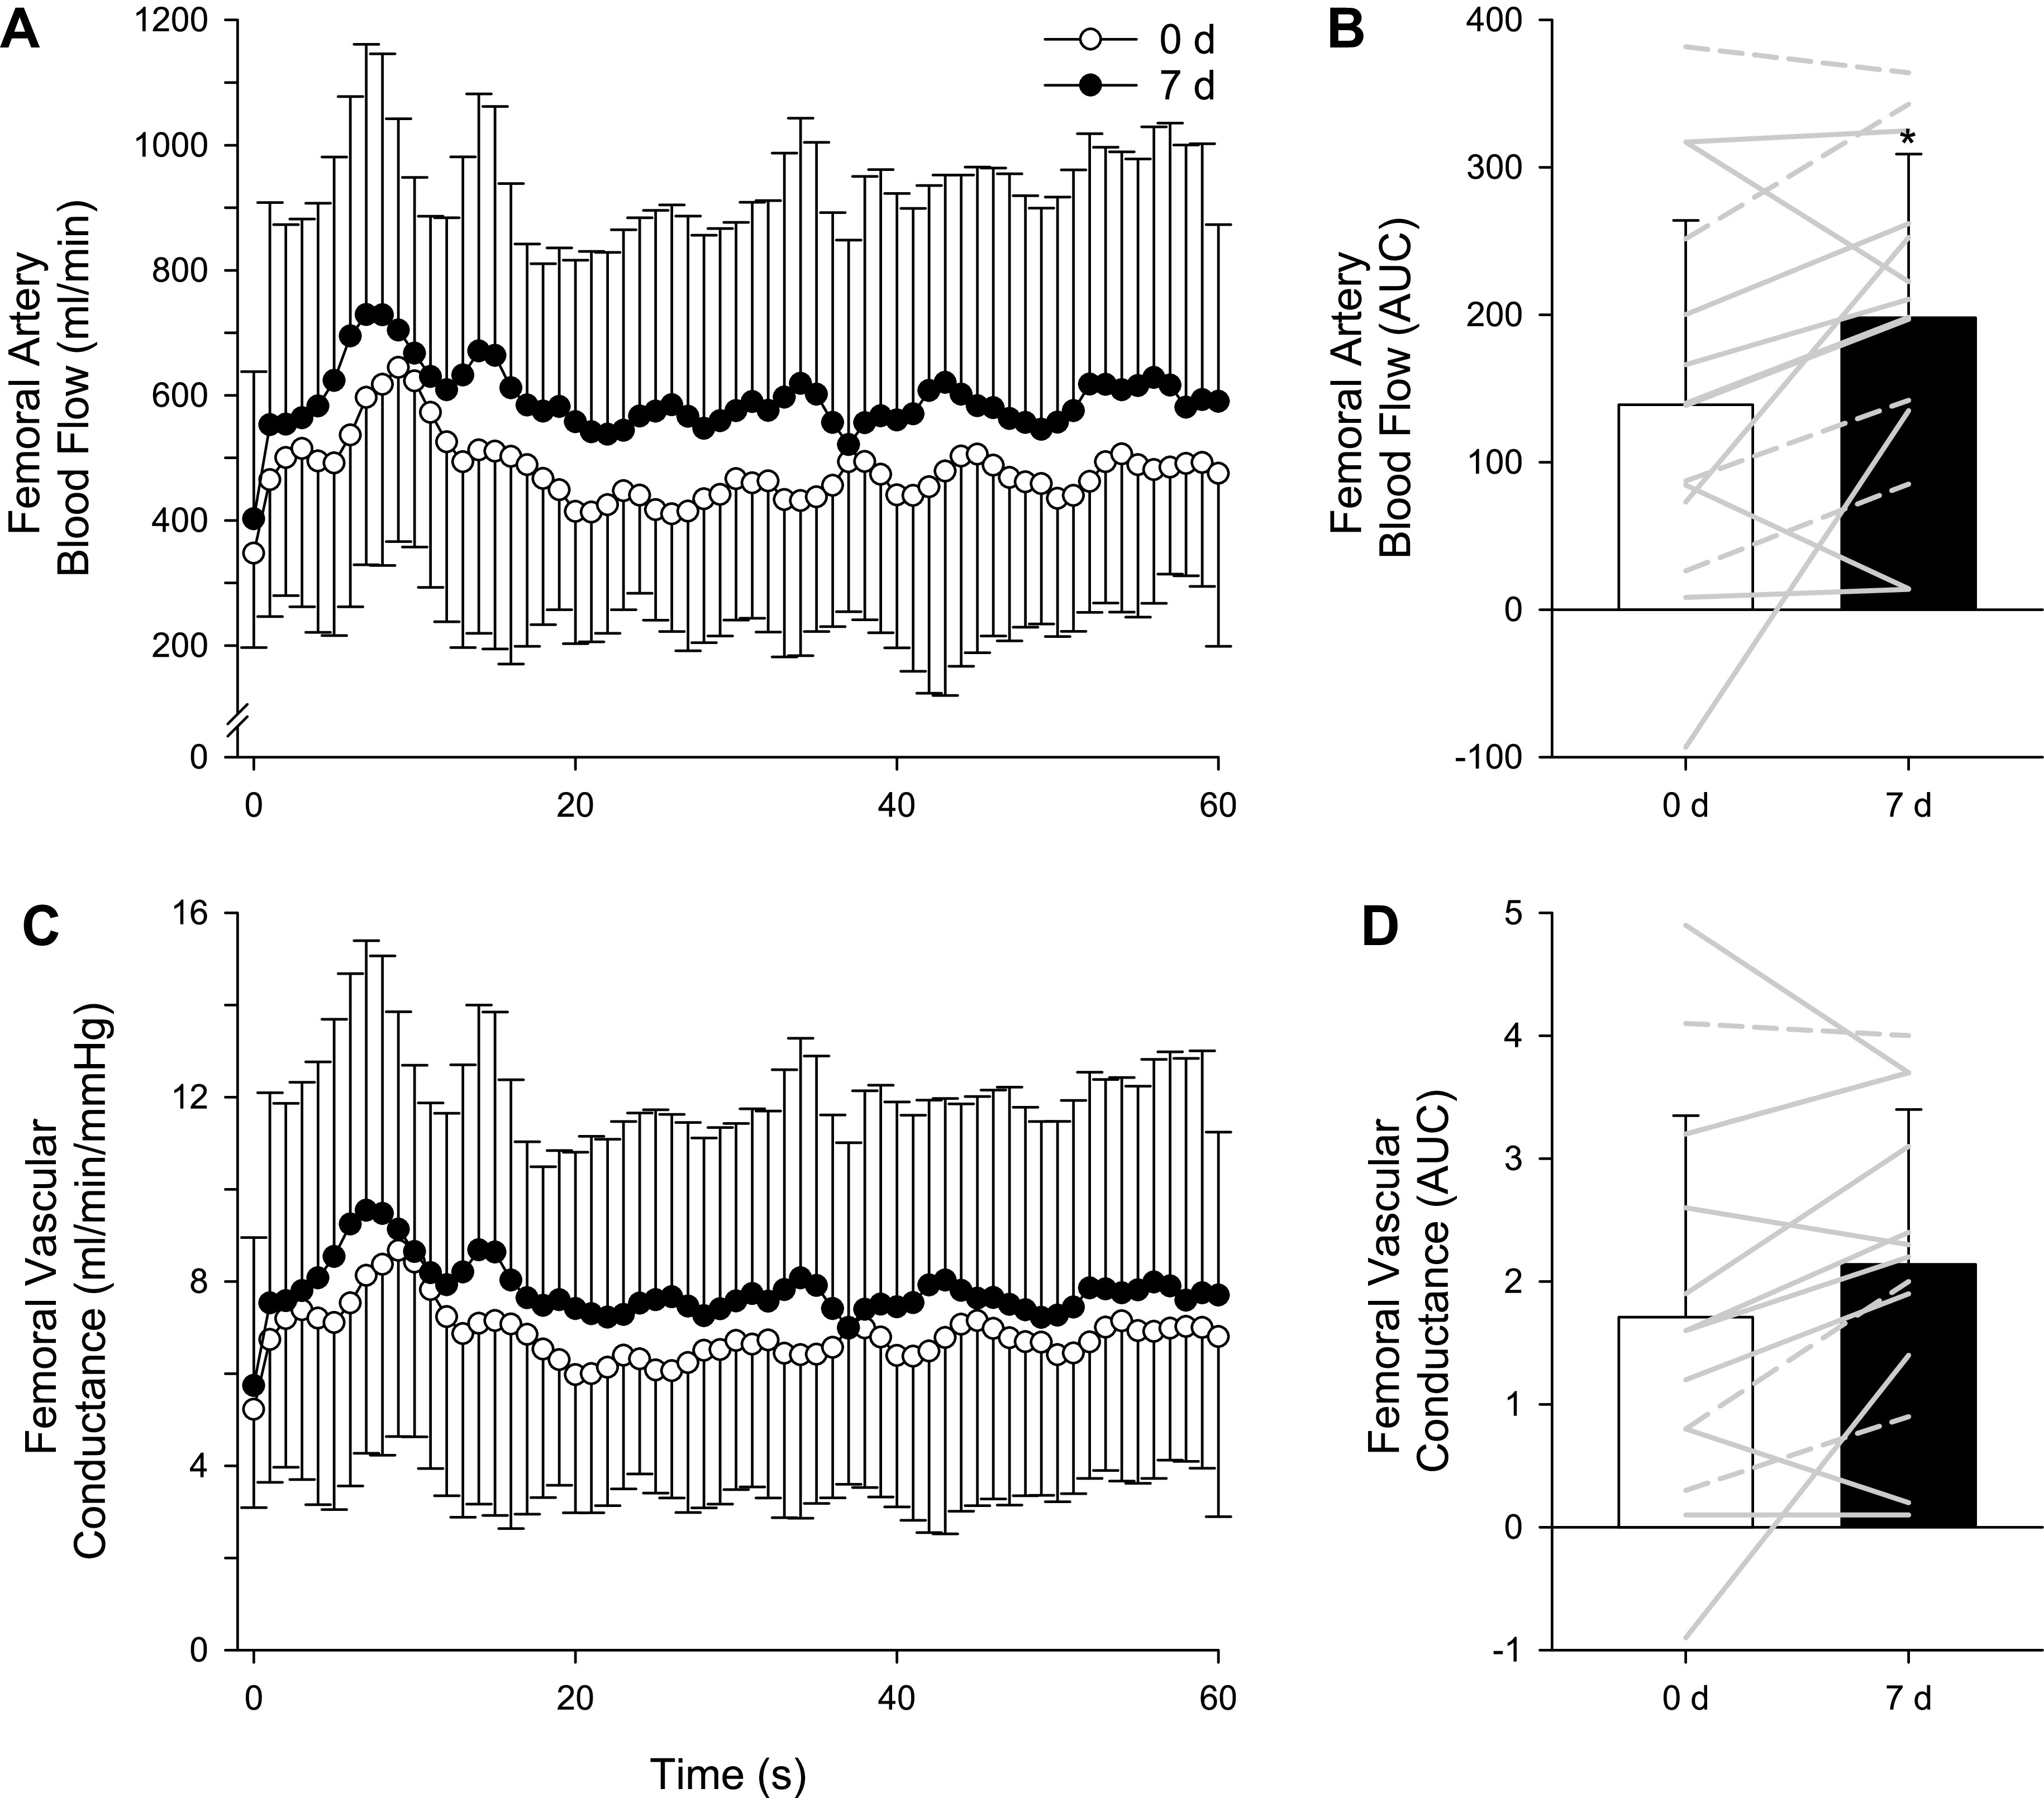
Figure 3.

A: femoral artery blood flow response to passive limb movement (PLM) responses before (white circles) and after (black circles) 7-d l-citrulline administration. Values are presented as means ± SD. Two-way repeated-measure analyses were performed, with the Bonferroni test used for post hoc analysis when a significant main effect was found. B: femoral artery blood flow area-under-the-curve (AUC) before (white bar) and after (black bar) 7-d l-citrulline administration. Gray lines indicate individual responses in females (solid lines, n = 10) and males (dashed lines, n = 4). Values are presented as means ± SD. Paired Student’s t test was performed. *Significant difference between 0 and 7 days, P = 0.011. C: femoral vascular conductance response to passive limb movement (PLM) responses before (white circles) and after (black circles) 7-d l-citrulline administration. Values are presented as means ± SD. Two-way repeated-measure analyses were performed, with the Bonferroni test used for post hoc analysis when a significant main effect was found. D: femoral vascular conductance area-under-the-curve (AUC) before (white bar) and after (black bar) 7-d l-citrulline administration. Gray lines indicate individual responses in females (solid lines, n = 10) and males (dashed lines, n = 4). Values are presented as means ± SD. Paired Student’s t test was performed.
