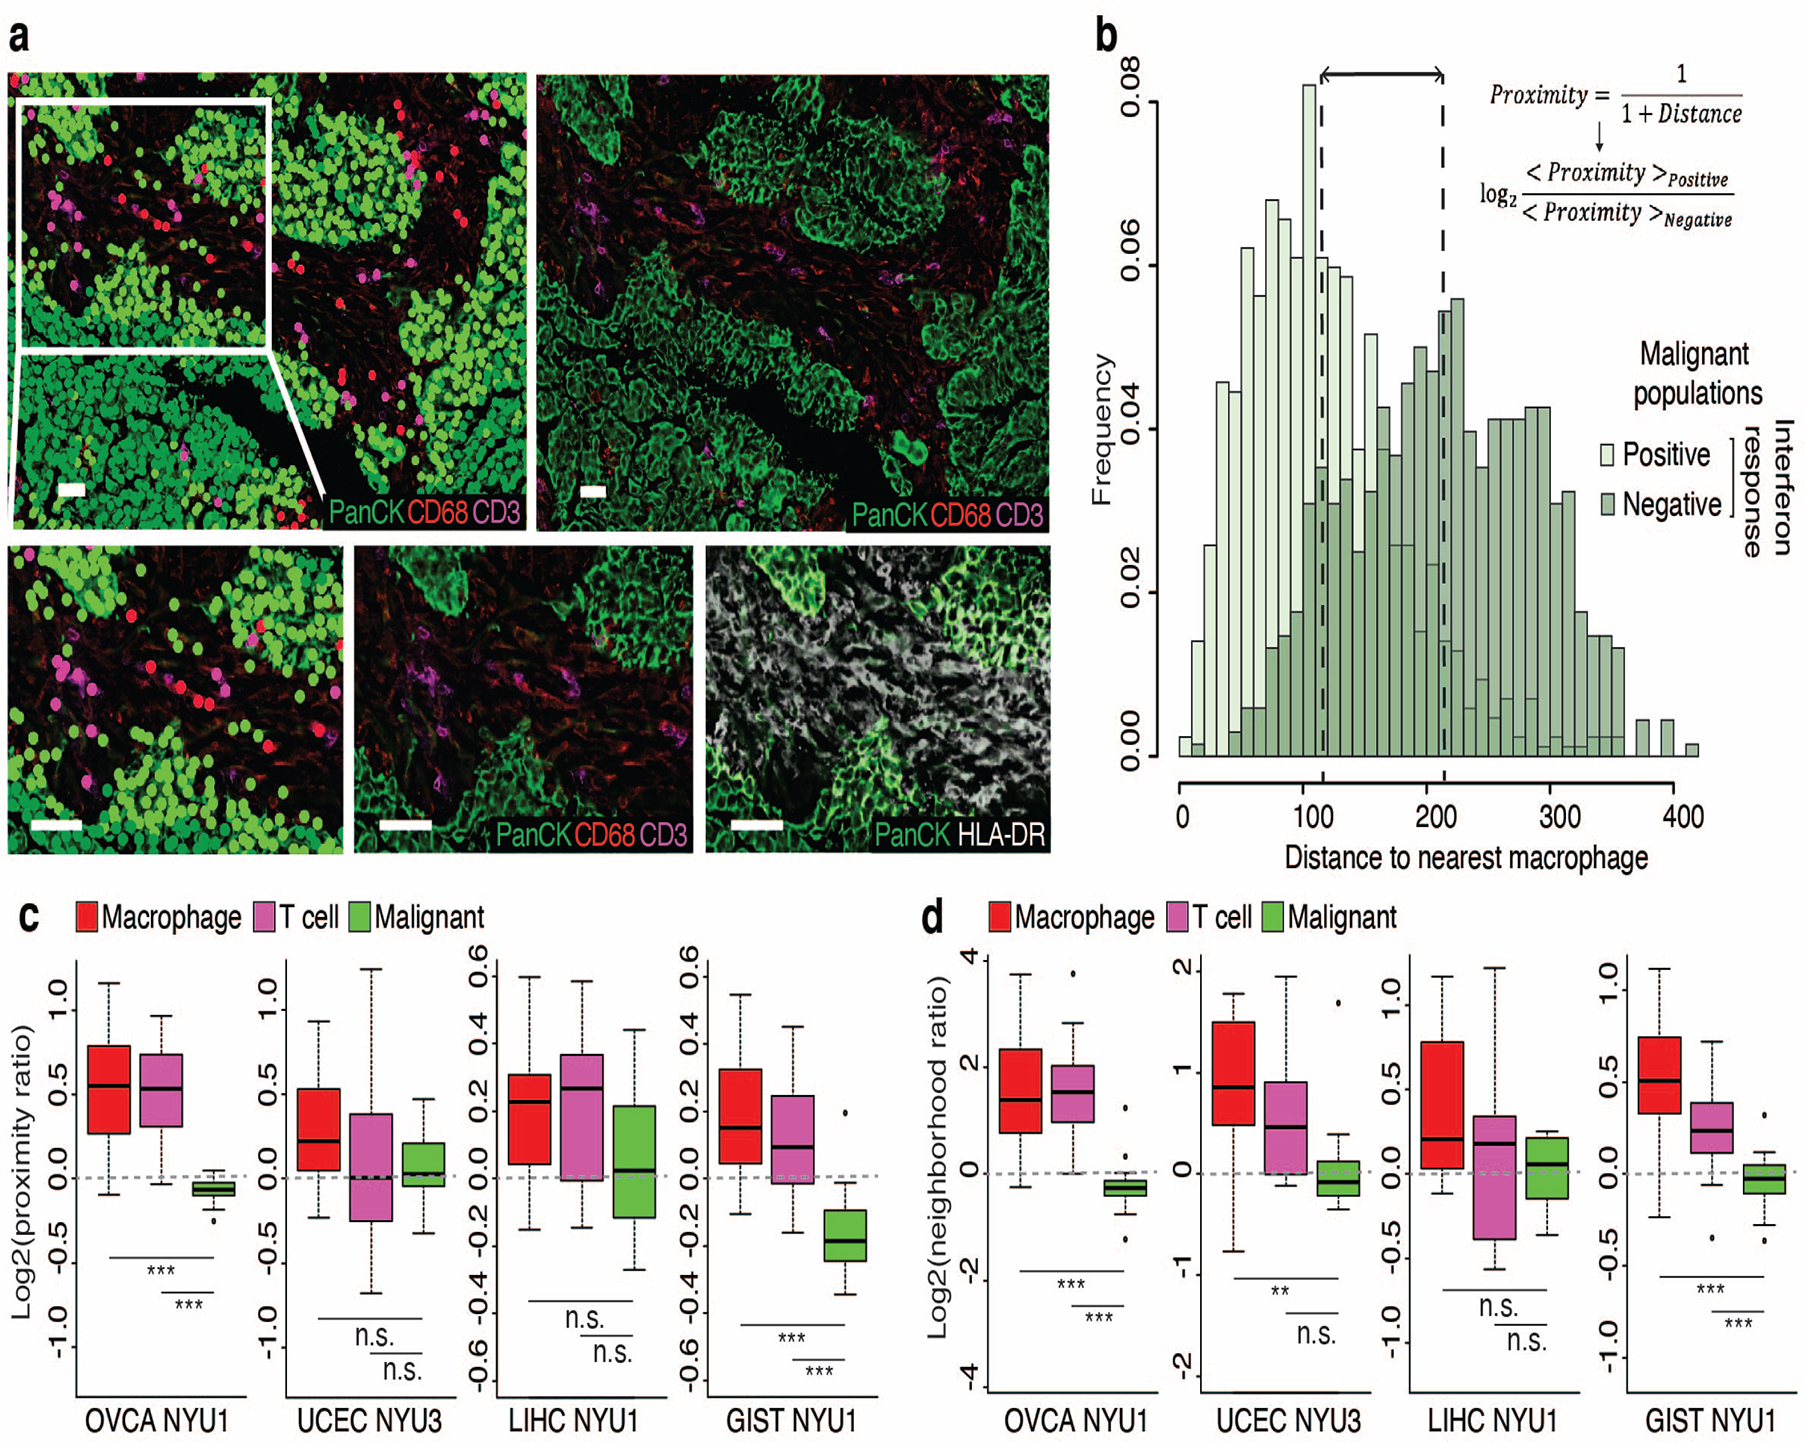
Extended Data Fig. 9. CODEX analysis of samples from four cancer types supporting a proximity of interferon responseexpressing malignant cells to macrophages and T cells.

a. Cell populations and marker expression in a region of OVCA NYU1. Top row displays an entire tile, bottom row displays an enlargement. Top and bottom left: Colored by populations as defined in Extended Data Fig. 15. Top right and bottom center: Colored by expression of markers used to define cell types, as indicated. Bottom right: Colored by expression of PanCK and of HLA-DRA, used to define interferon response positive and negative malignant cells. Scale bar represents 50μm.
b. For the tile shown in a., histogram showing the distance between malignant cells and the nearest macrophage, for interferon-response positive (light green) and negative (dark green) malignant cells. Lines indicate the mean distance for each population, used to calculate the log2(proximity ratio). c-d. Boxplots of the distribution of log2(proximity ratio) (c) and log2(neighborhood ratio) (d) of macrophages, T cells and malignant cells across tiles of each sample (*, p-value<0.05; ***, p-value<0.001; two-sided t-test). For each boxplot, the line indicates the median, the box indicates the 1st and 3rd quartile, the whiskers indicate the minimum and maximum values.
