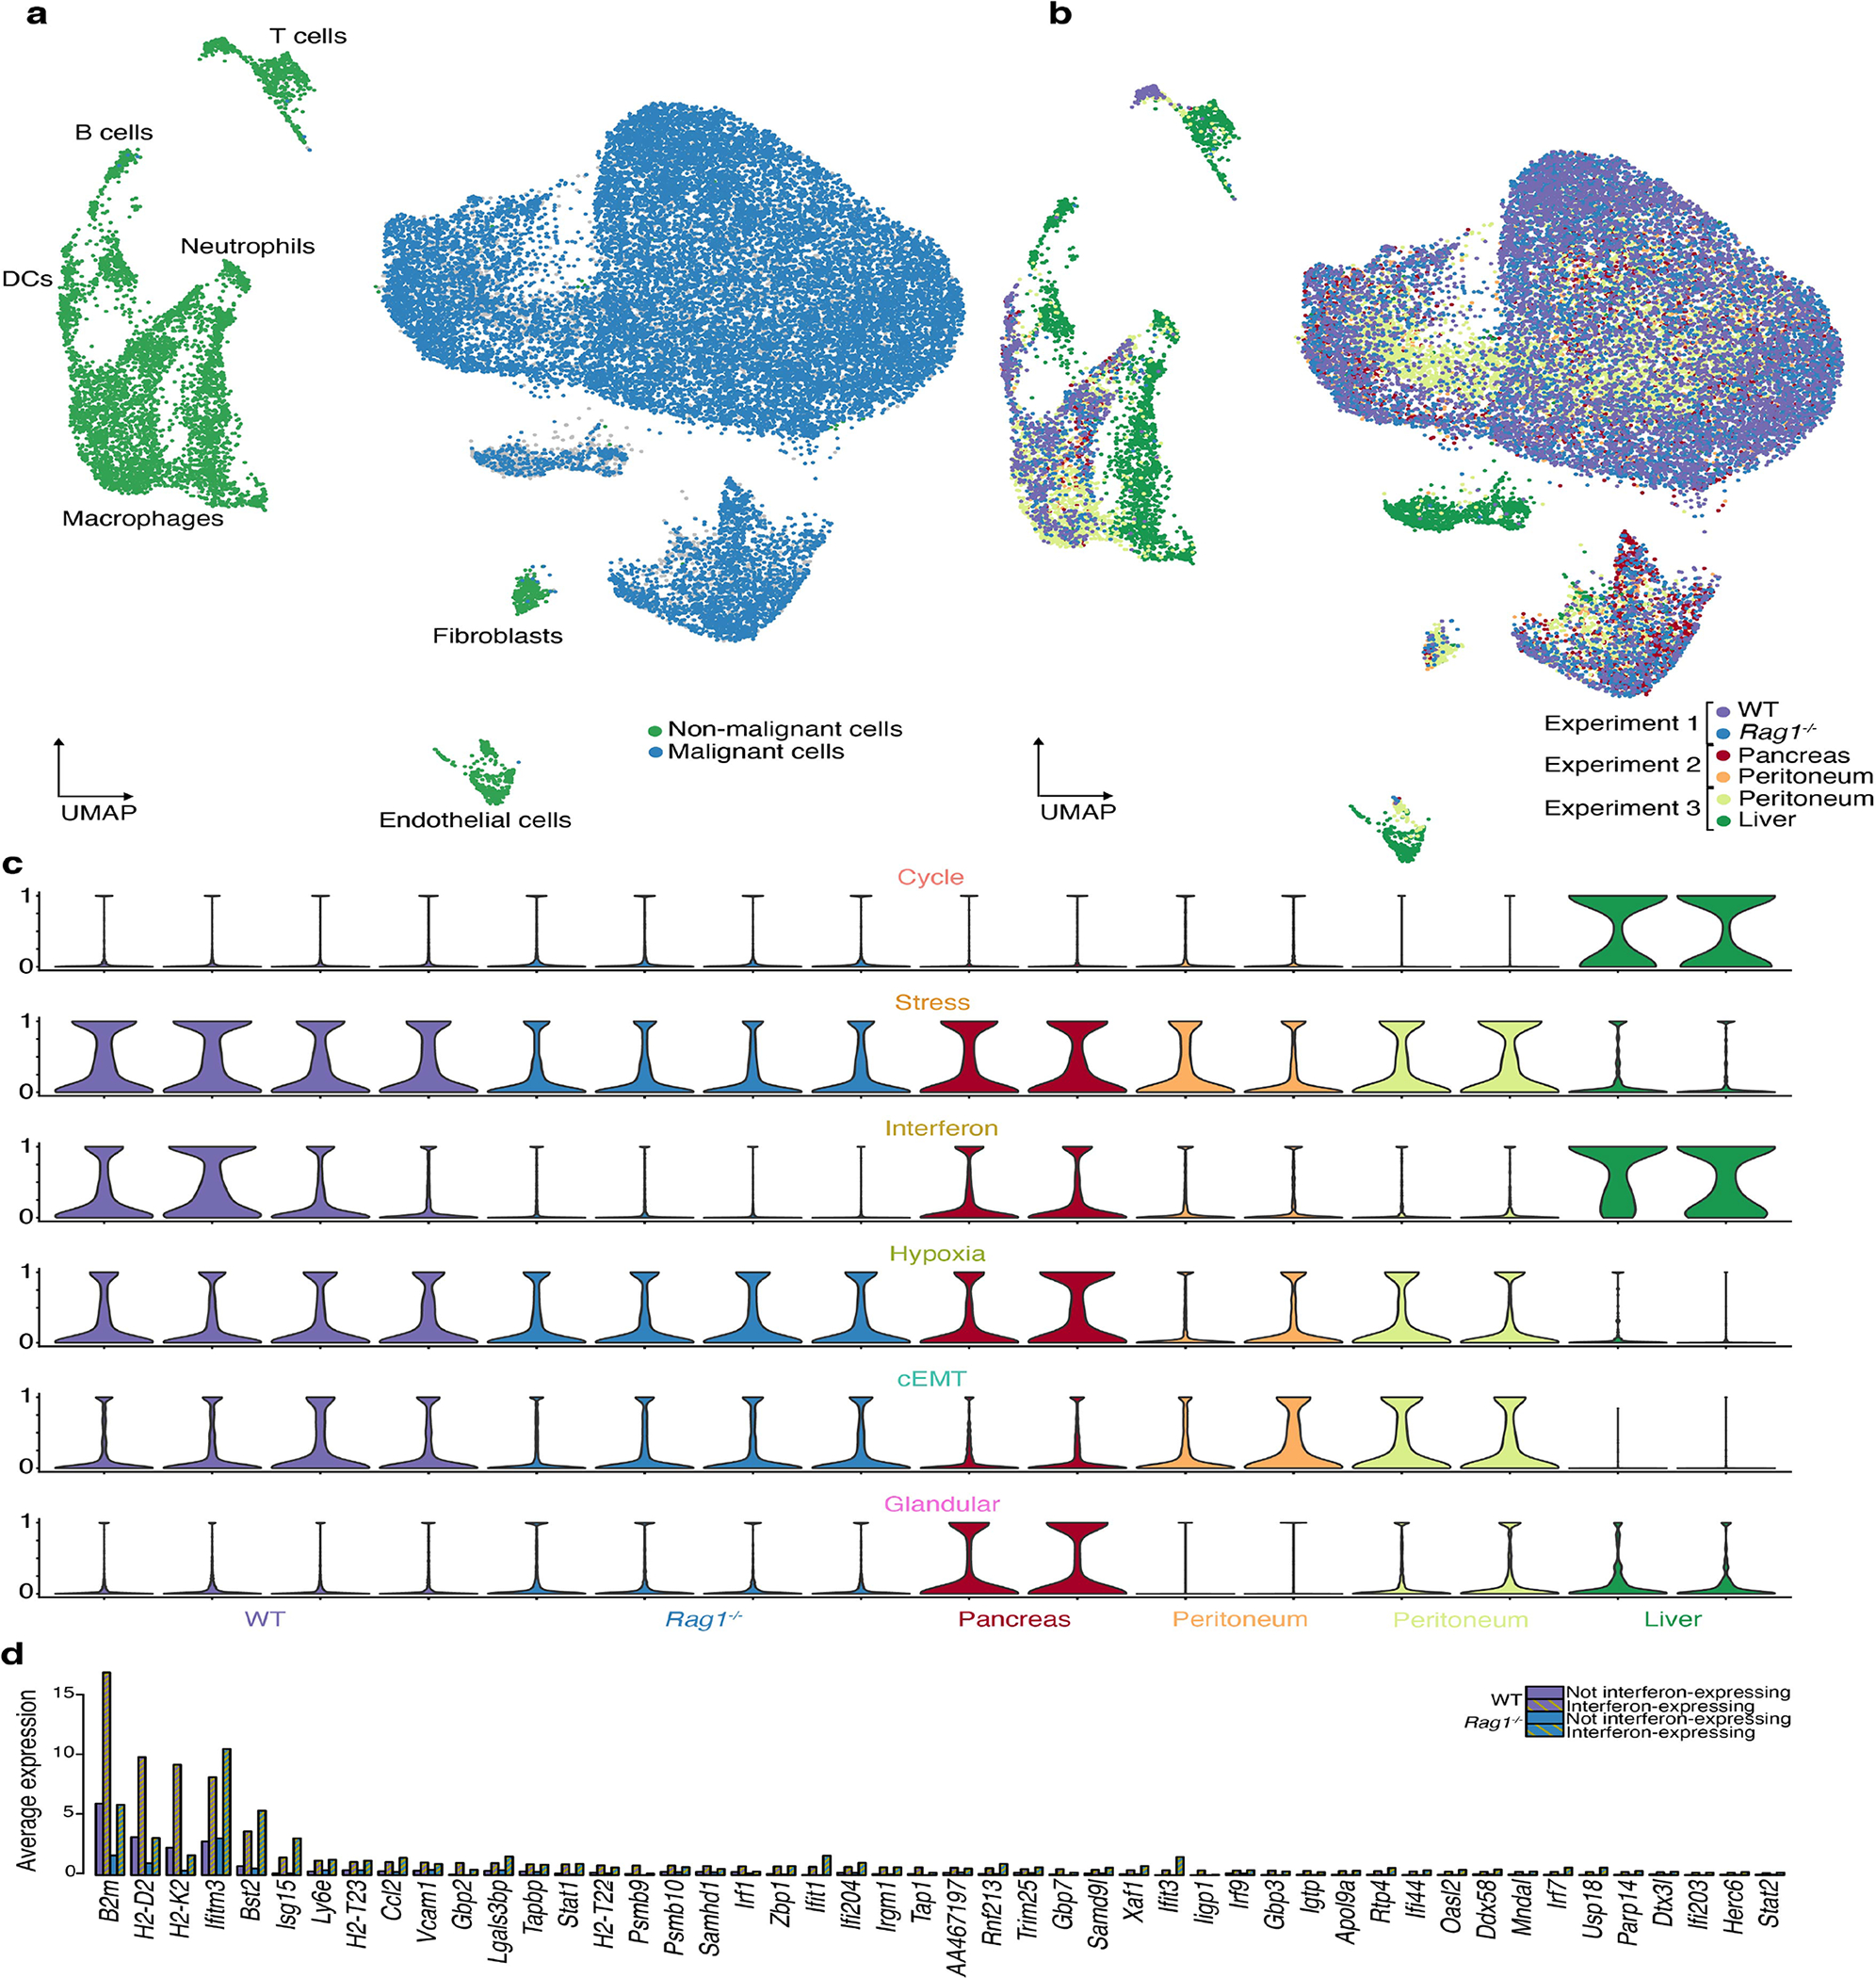
Extended Data Fig. 10. Additional experiments.

a. UMAP embedding of cells from 16 orthotopic pancreatic tumors across relating to the orthotopic and heterotopic mouse experiments. the 3 experiments, colored by annotation as malignant or non-malignant cells.
b. Same as a, colored by sample.
c. Violin plots of module expression scores in individual tumors across the 3 experiments. Barplots of the average expression of the interferon response module genes in cancer cells in the WT and Rag1−/− tumors according to their interferon response expression.
