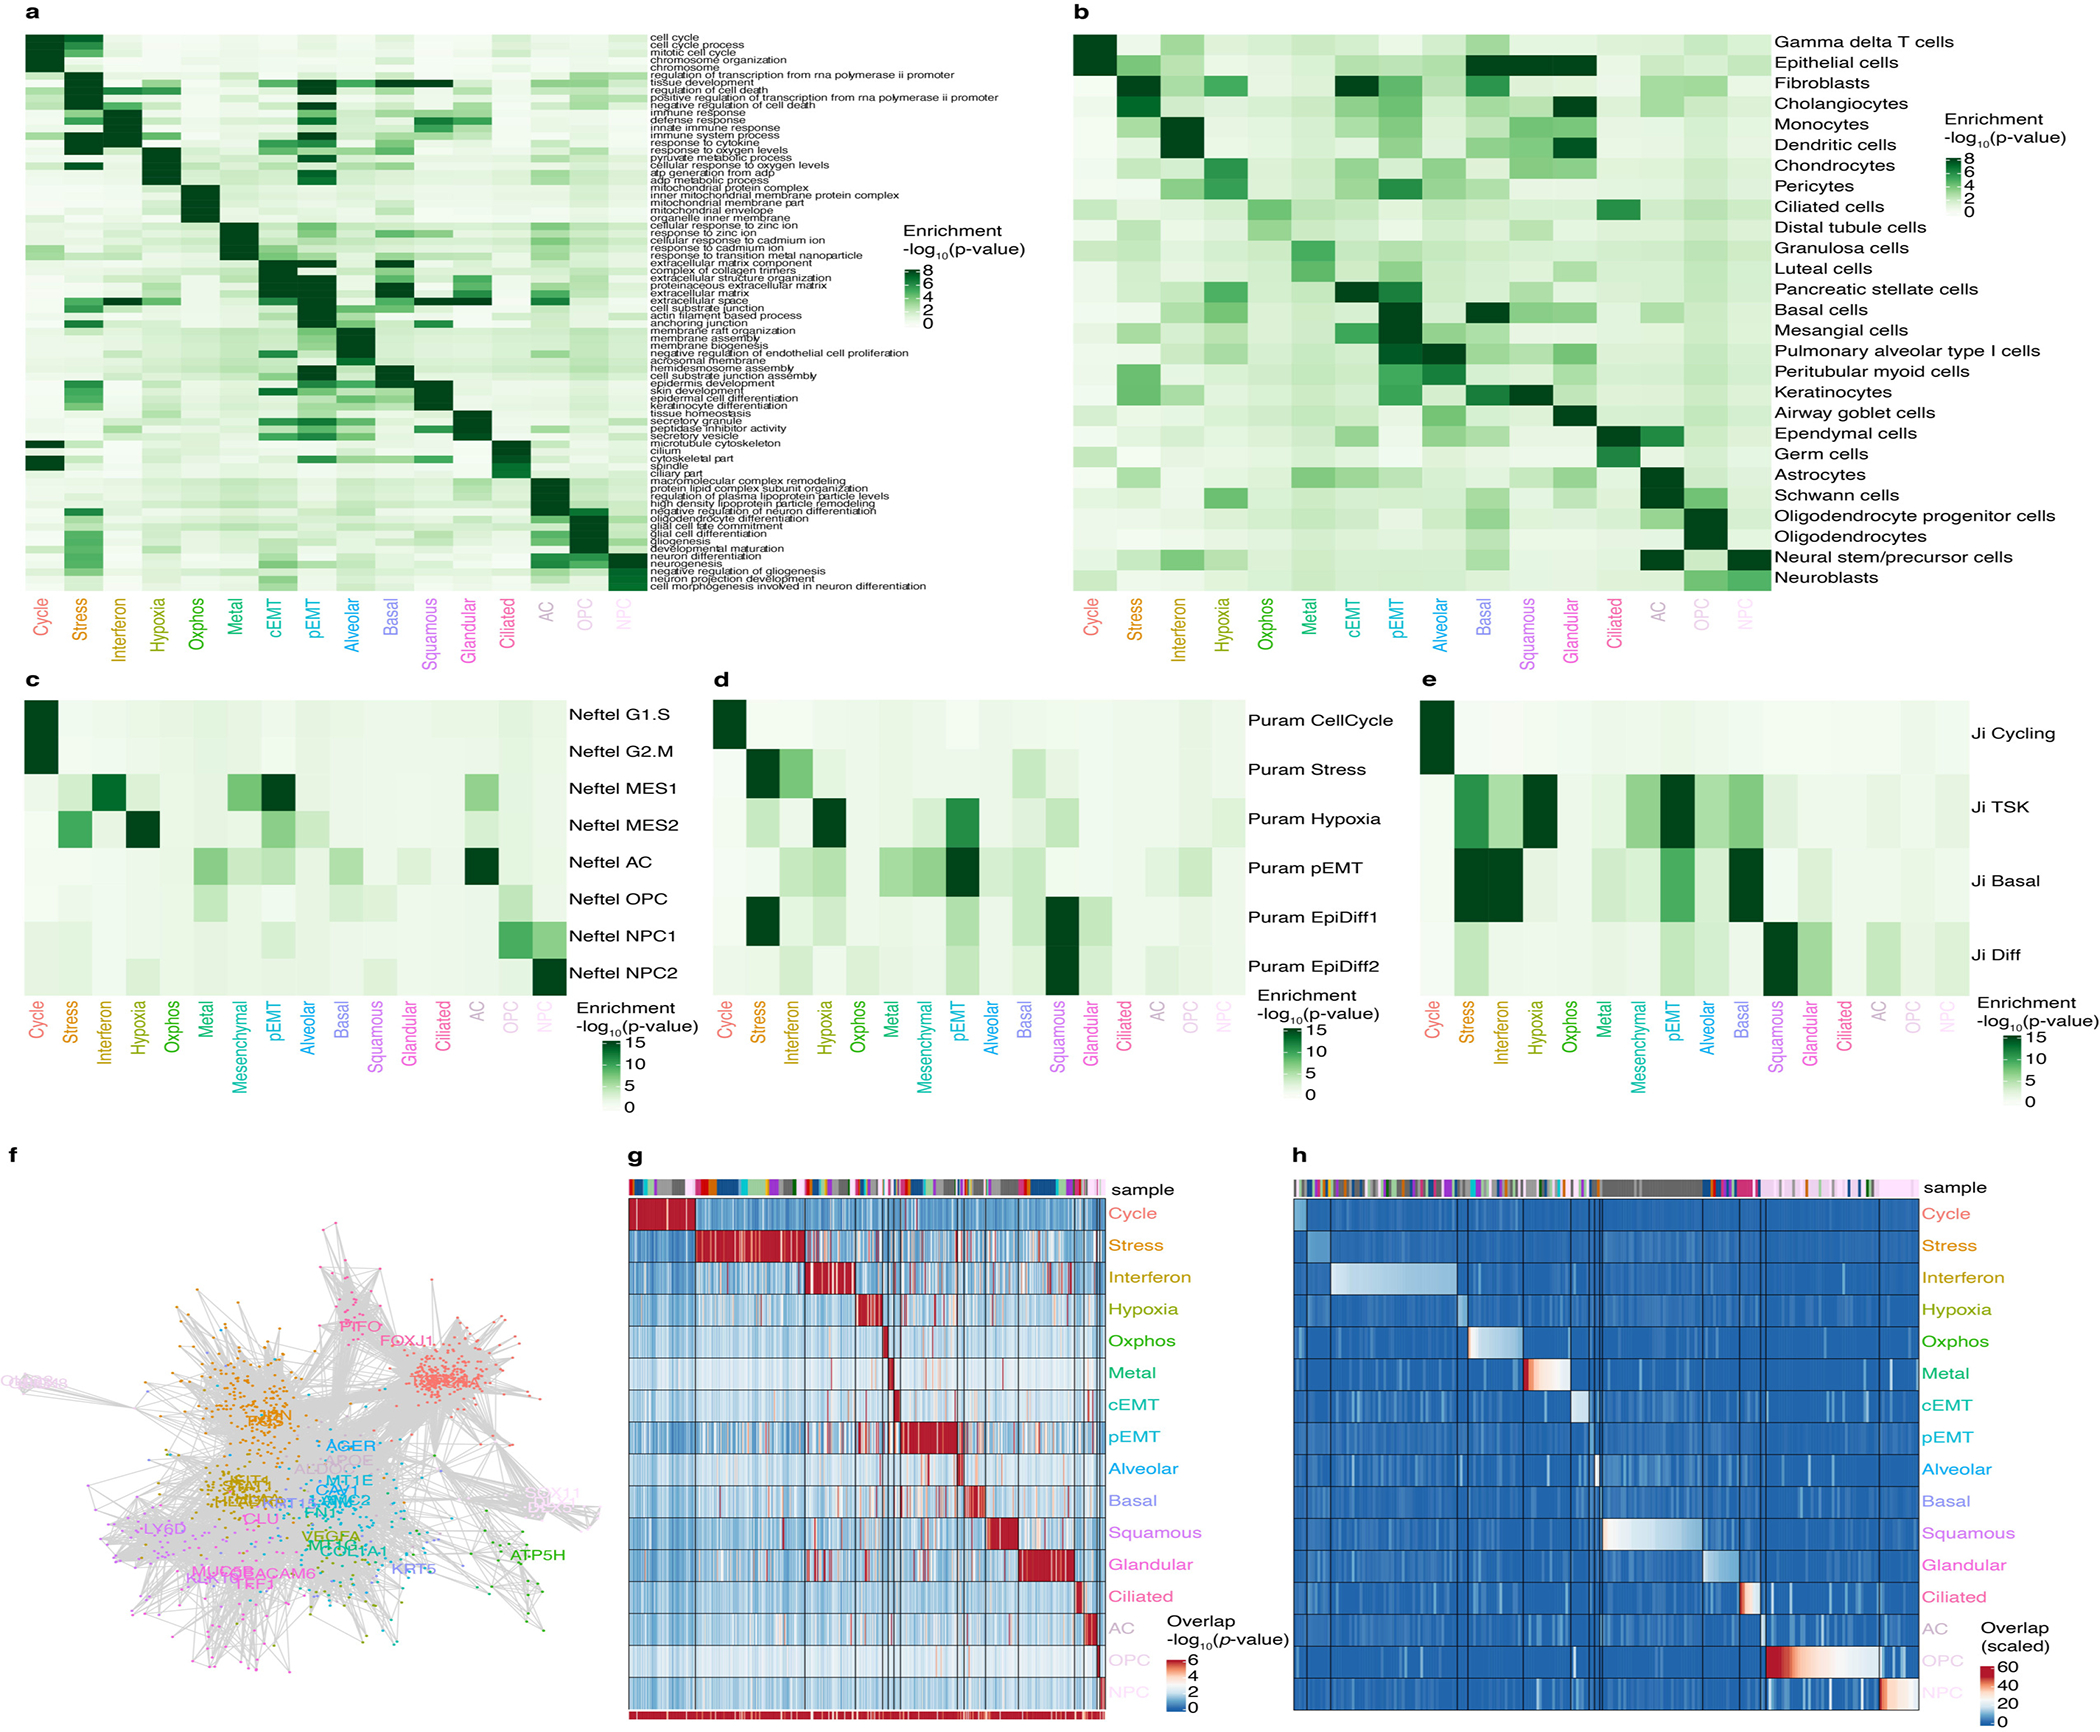
Extended Data Fig. 3. Additional analyses for the derivation of the cancer gene modules catalog.

a-e. Heatmap of the significance of overlap (hypergeometric test) of the consensus modules across (a) the indicated Gene Ontology terms, (b) cell type markers, (c) signatures derived by Neftel et al.2, (d) signatures derived from Puram et al.3, and (e) signatures derived from Ji et al.4.
f. Network of genes belonging to the consensus modules, colored as in Figure 1f. Lines connect genes that are found together in at least 2 individual tumor modules (see Methods).
g. Heatmap of the significance of the overlap between consensus modules and individual tumor modules (hypergeometric test). The bottom bar indicates the significance of the overlap with consensus modules (hypergeometric test). The top bar indicates the identity of the tumor samples, colored as in Figure 1a.
h. Heatmap of the Jaccard similarity (intersect/union) between consensus modules and SCENIC regulons obtained for individual tumors. The bar indicates the identity of the tumor samples, colored as in Figure 1a. To test whether the catalog of 16 modules can also be detected using an independent approach, we used SCENIC5, a method that identifies genes that are both correlated in their expression and regulated by the same transcription factor. We found that each module of our catalog had significant overlap with several SCENIC regulons (Supplementary Table 4, see Methods). For instance, the interferon response module overlapped with several SCENIC regulons annotated with the transcription factors STAT1 and IRF1.
