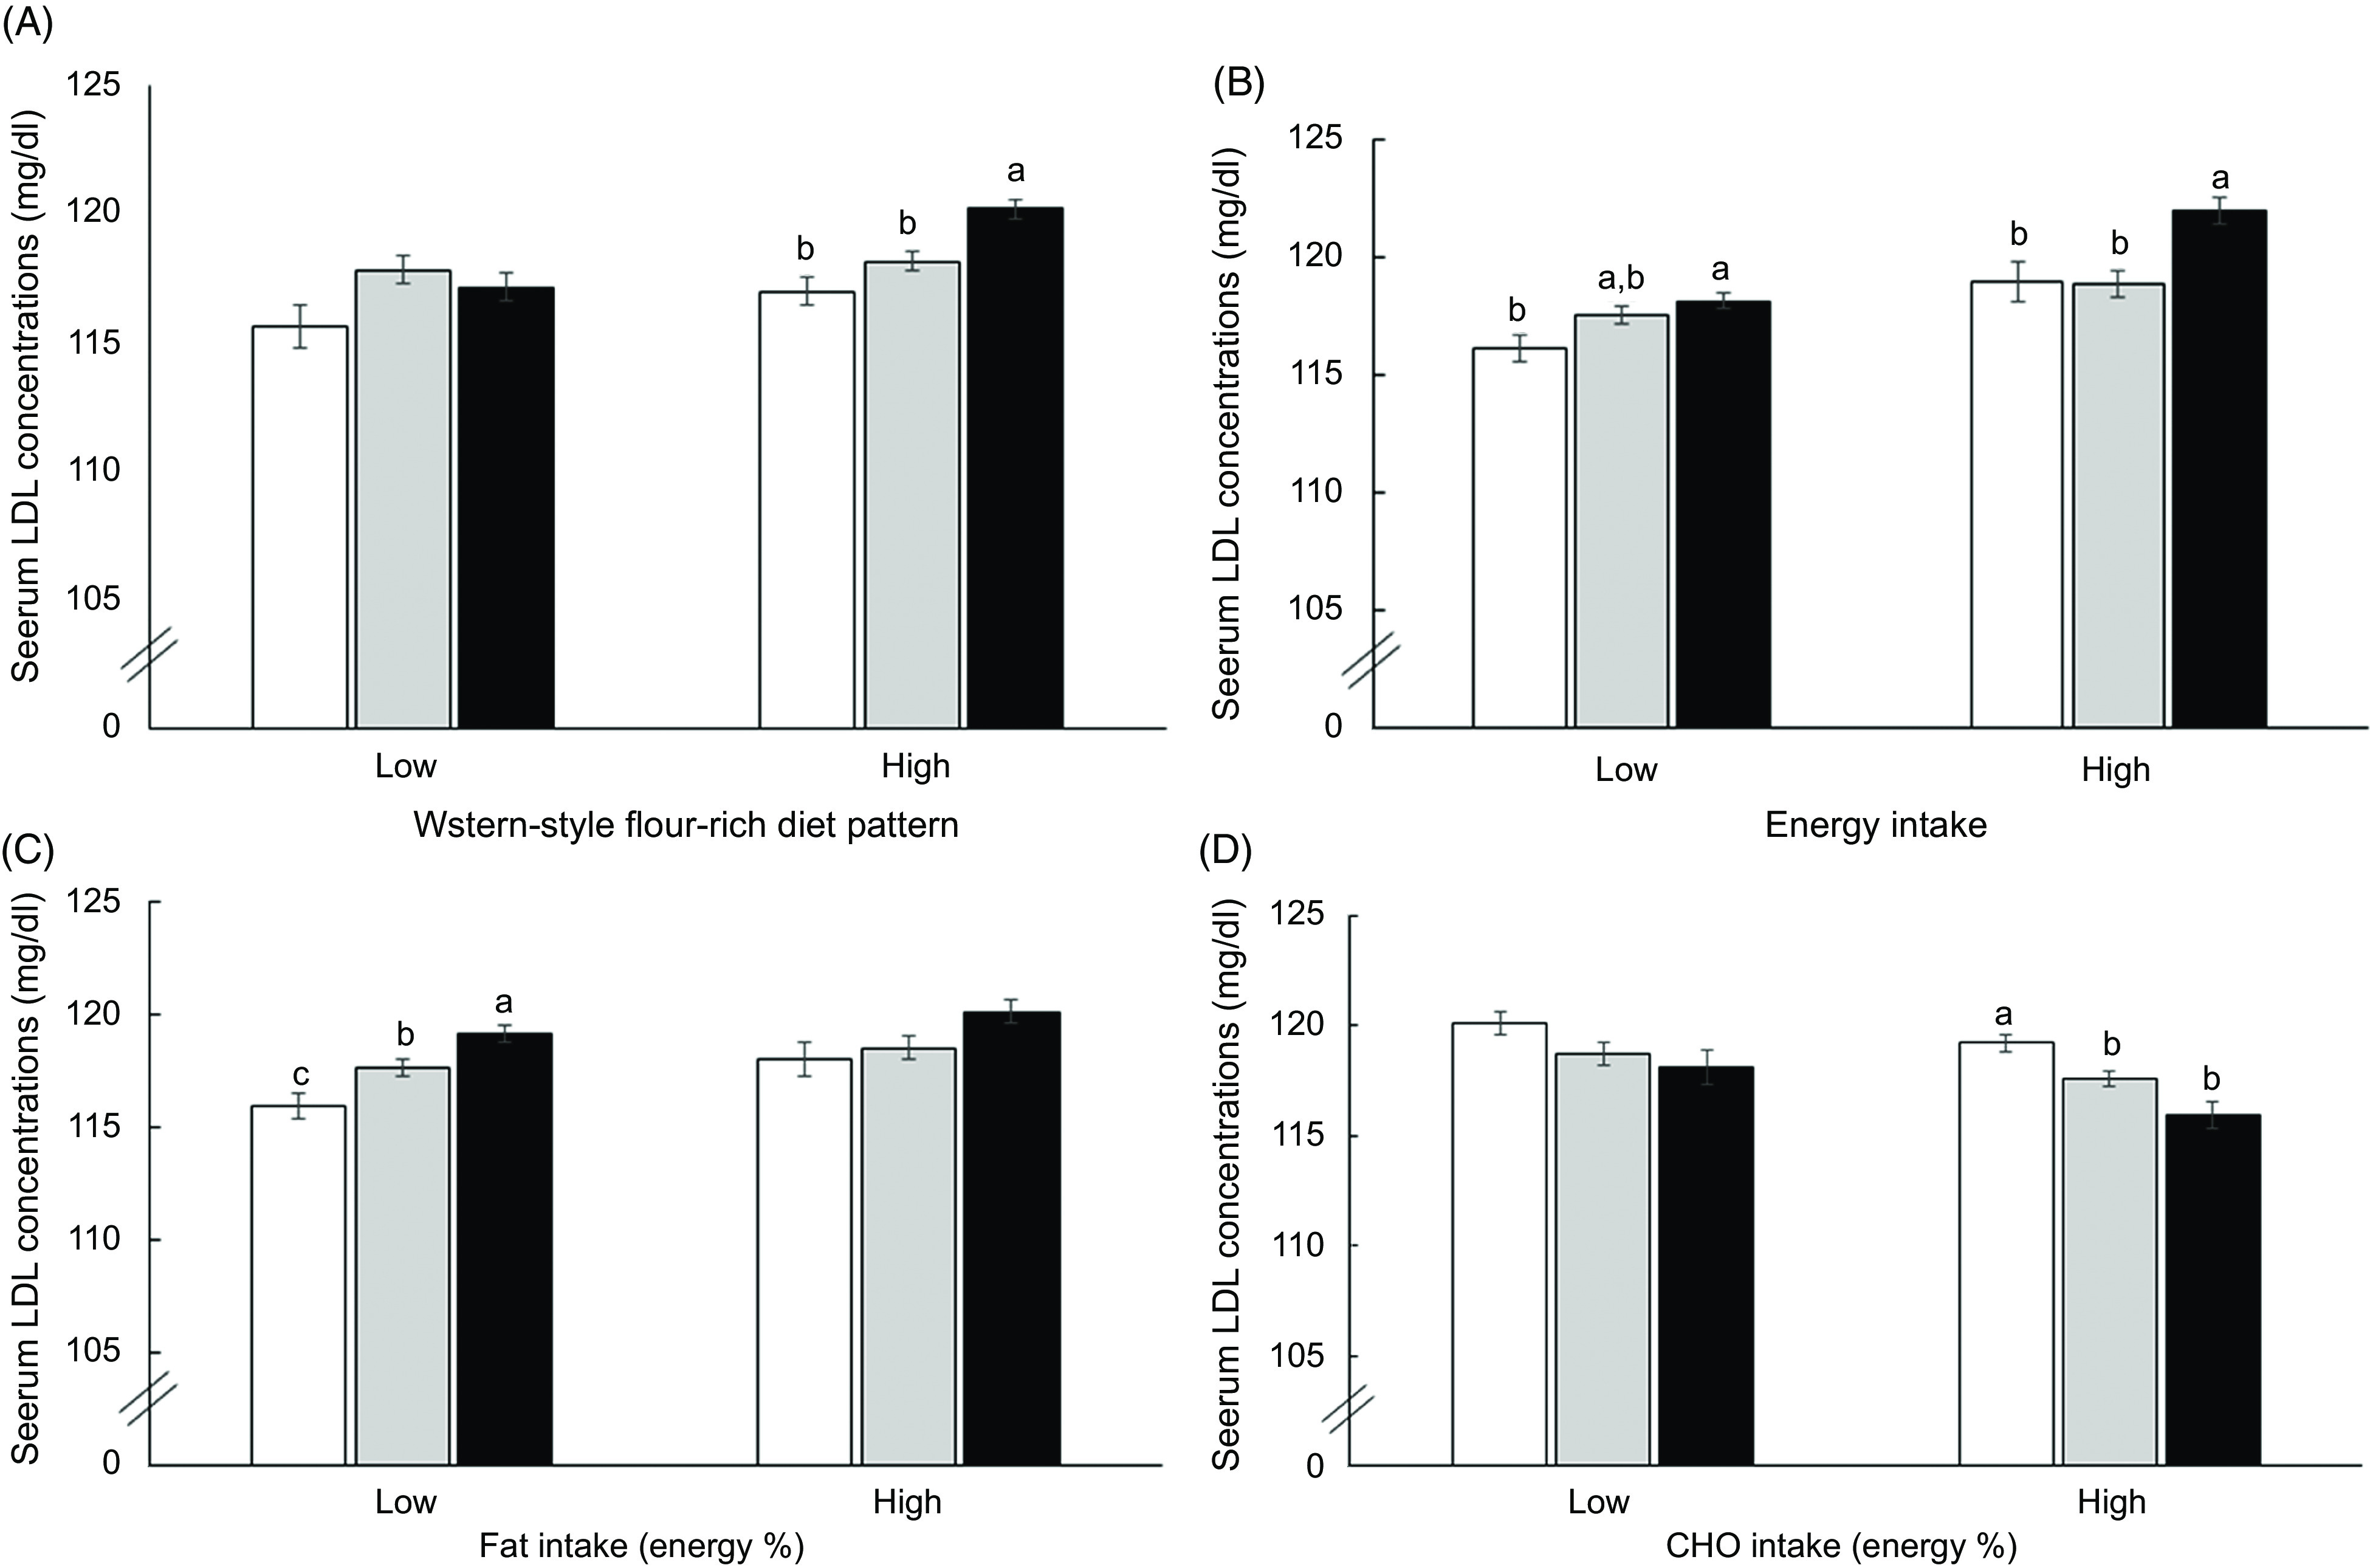
Fig. 1.

Serum LDL concentrations of subjects with Low-, Medium- and High-genetic risk score (GRS) generated with LDLR rs1433099 and rs11557092, PCSK9 rs11583723 and APOB rs13306194 according to high and low nutrient intake and smoking status. (A) Western-style flour-rich diet pattern. (B) Energy intake (dietary reference intake; DRI). (C) Fat intake (reference: 15 %). (D) Carbohydrate intake (reference: 70 %). P-value indicated the significance of the interaction of GRS and nutrient intake to affect serum LDL concentration. Each bar and error bar represents means ± se. a,b,c Unlike superscript letters on the bars indicate significant differences at P < 0·05. (A) to (D) ( ), Low-GRS; (
 ), Medium-GRS; (
 ), High-GRS
