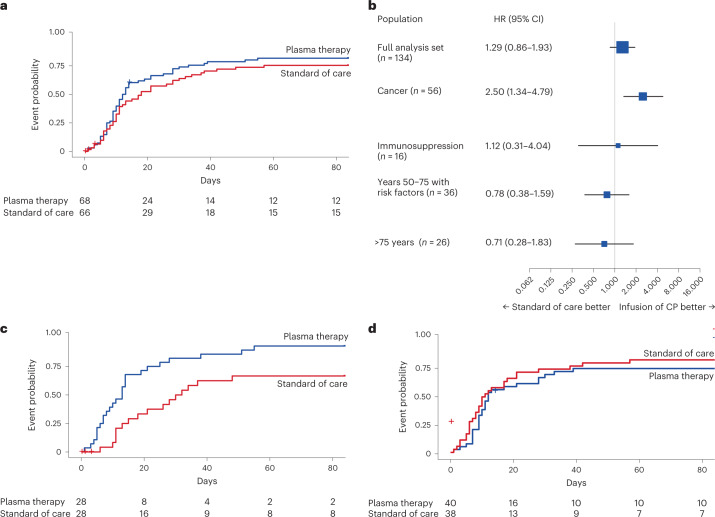
Fig. 2. Primary endpoint (time to improvement of two points on the 7POS or live hospital discharge).
a, Kaplan–Meier curve for the primary endpoint of a two-point improvement on the 7POS or live hospital discharge for the overall study cohort (groups 1–4) by plasma arm (blue) and control arm (red). The median time to improvement was 12.5 d (95% CI = 10–17) for the plasma arm and 18 d (95% CI = 11–28) for the control arm (log-rank P = 0.205). b, Forest plot with HRs for the primary endpoint overall (full analysis set) and by predefined subgroups. 95% CIs are provided in parentheses. The HRs are presented as the centers of the error bars. The error bars range from the lower to the upper 95% confidence limit. CP, convalescent plasma. c, Kaplan–Meier curve for the primary endpoint for group 1 by plasma arm (blue) and control arm (red). The median time to improvement was 13 d (95% CI = 7–14) for the plasma arm and 31 d (95% CI = 15–NA) for the control arm (log-rank P = 0.003). d, Kaplan–Meier curve for the primary endpoint for combined groups 2–4 by plasma arm (blue) and control arm (red). The median time to improvement was 12 d (95% CI = 10–28) for the plasma arm and 11 d (95% CI = 8–21) for the control arm (log-rank P = 0.3902). In a, c and d, the numbers of participants at risk are detailed below the Kaplan–Meier plot. See Extended Data Fig. 3 for separate data for groups 2–4.

