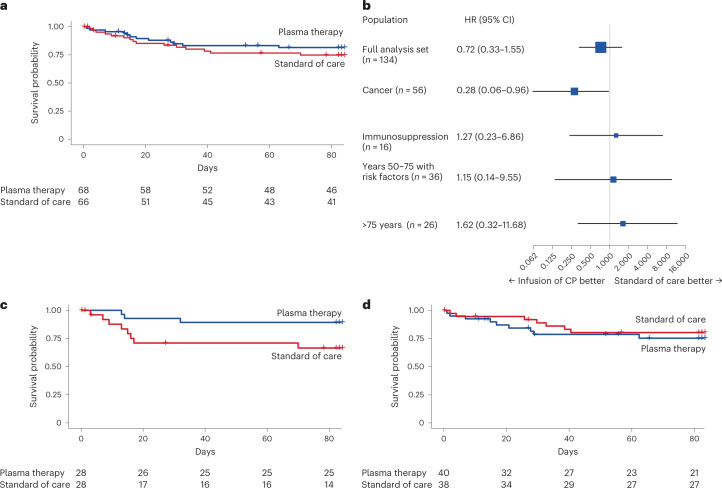
Fig. 3. Secondary endpoint (overall survival).
a, Kaplan–Meier curve for survival probability for the overall study cohort (groups 1–4) by plasma arm (blue) and control arm (red) (log-rank P = 0.403). b, Forest plot with HRs for survival probability overall and by predefined subgroups. 95% CIs are provided in parentheses. The HRs are presented as the centers of the error bars. The error bars range from the lower to the upper 95% confidence limit. c, Kaplan–Meier curve for survival probability for group 1 by plasma arm (blue) and control arm (red) (log-rank P = 0.042). d, Kaplan–Meier curve for survival probability for combined groups 2–4 by plasma arm (blue) and control arm (red) (log-rank P = 0.555). In a, c and d, the numbers of participants at risk are detailed below the Kaplan–Meier plot. See Extended Data Fig. 4 for separate data for groups 2–4.

