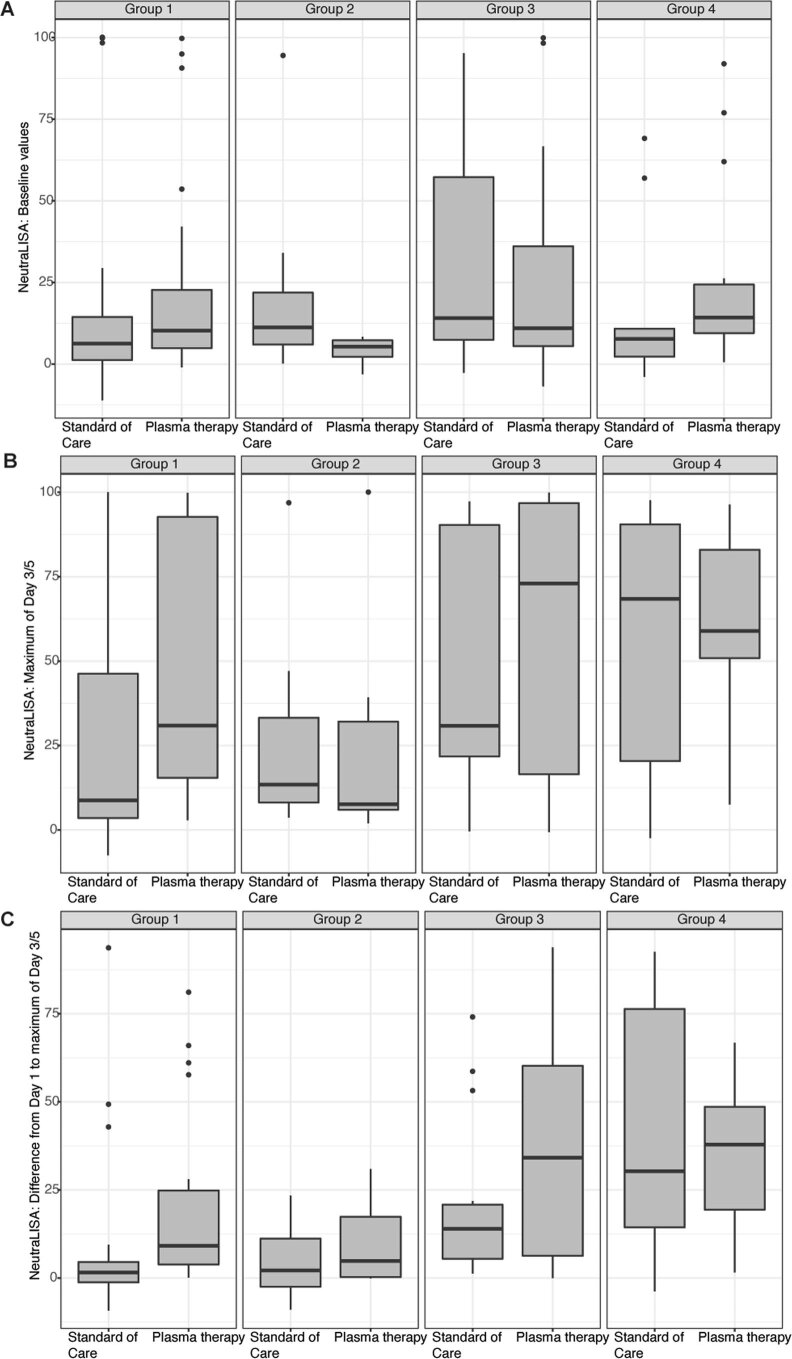
Extended Data Fig. 5. NeutraLISA measurement in the four subgroups.
(a) Baseline neutralizing activity in group-1 (CONTROL: n = 24, PLASMA: n = 25), group-2 (CONTROL: n = 8, PLASMA: n = 6), group-3 (CONTROL: n = 14, PLASMA: n = 18) and group-4 (CONTROL: n = 9, PLASMA: n = 14) measured by a surrogate inhibition assay on day 1 (after randomization and prior to plasma treatment). Boxplots indicate the interquartile range and whisker length is limited to 1.5 times the interquartile range. Medians are indicated within the boxes. (b) Highest levels of neutralizing activity on day 3/5 in group-1 (CONTROL: n = 25, PLASMA: n = 26), group-2 (CONTROL: n = 8, PLASMA: n = 7), group-3 (CONTROL: n = 15, PLASMA: n = = 18) and group-4 (CONTROL: n = 10, PLASMA: n = 13) measured by a surrogate inhibition assay on day 1 (after randomization and prior to plasma treatment). Boxplots indicate the interquartile range and whisker length is limited to 1.5 times the interquartile range. Medians are indicated within the boxes. (c) Increase in neutralizing activity analyzed as the percent difference in neutralizing activity as measured by a surrogate inhibition assay on day 1 (after randomization and prior to plasma treatment) and compared to the highest level of day 3/5 in group-1 (CONTROL: n = 24, PLASMA: n = 25), group-2 (CONTROL: n = 8, PLASMA: n = 6), group-3 (CONTROL: n = 14, PLASMA: n = 18) and group-4 (CONTROL: n = 9, PLASMA: n = 13) measured by a surrogate inhibition assay on day 1 (after randomization and prior to plasma treatment). Boxplots indicate the interquartile range and whisker length is limited to 1.5 times the interquartile range. Medians are indicated within the boxes.

