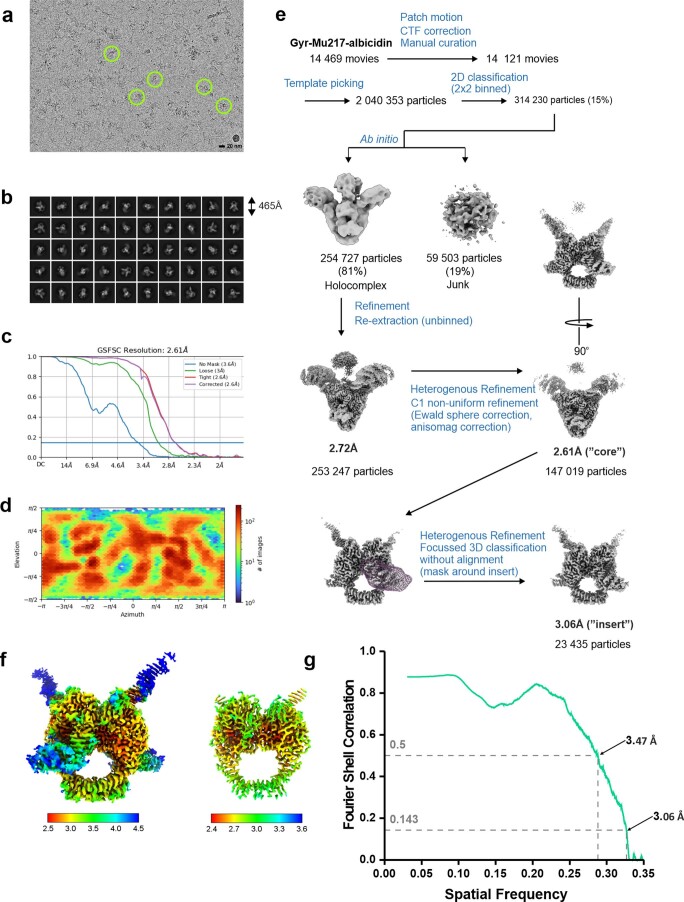
Extended Data Fig. 2. Cryo-EM data processing for Gyr-Mu217-albicidin.
a. A representative micrograph with example gyrase particles indicated. b. A selection of 2D classes, box size in angstroms indicated. c. FSC curve for the highest-resolution reconstruction as outputted by cryoSPARC. d. Euler angle distribution as output by cryoSPARC. e. Processing scheme (see Methods for description). f. Local resolution maps contoured at two different levels (5σ; 15σ) to illustrate resolution distribution from >2.5 Å next to the DNA and compound to <4 Å at the ends of the TOPRIM insert. g. Map-to-model curve.

