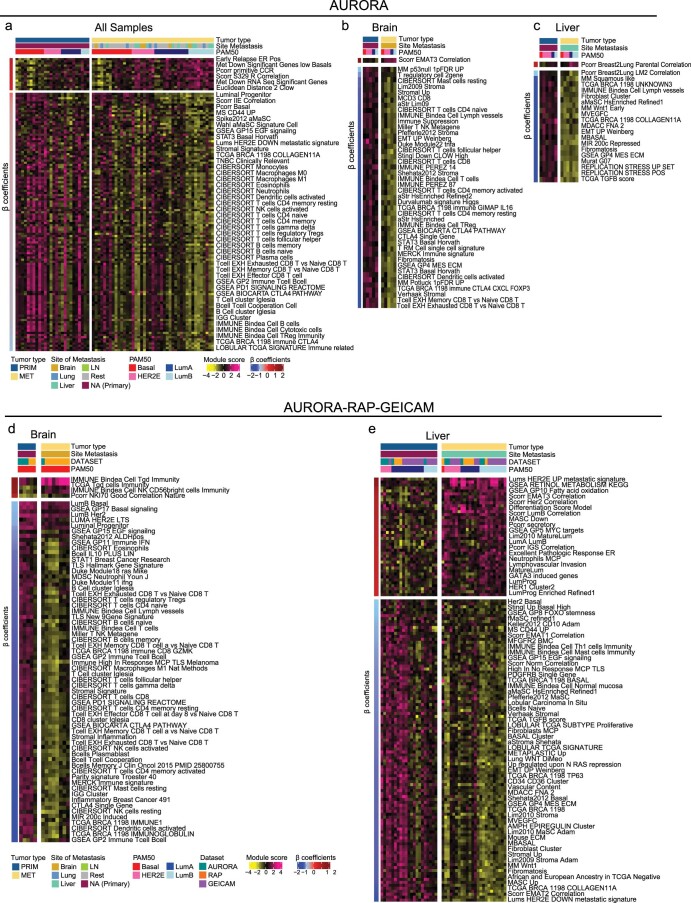
Extended Data Fig. 5. Supervised analysis of gene expression signatures according to site of metastasis in AURORA or combined AURORA-RAP-GEICAM cohorts.
a. Heatmap depicting the differentially expressed (DE) signatures between primary (n = 26) and metastasis (n = 69) in the AURORA cohort using all samples. b. Heatmap depicting the DE signatures between paired primary (n = 5) and brain metastasis (n = 5) in the AURORA cohort. c. Heatmap depicting the DE signatures between paired primary (n = 6) and liver metastasis (n = 6) in the AURORA cohort. d. Heatmap depicting the DE signatures between basal-like paired primary (n = 5) and brain metastasis (n = 8) in the AURORA-RAP-GEICAM cohort. d. Heatmap depicting the DE signatures between luminals (LumA, LumB, and HER2E) paired primary (n = 21) and liver metastasis (n = 24) in the AURORA-RAP-GEICAM cohort. Significance of the differences between primary and metastasis was calculated using linear mixed models (q < 0.05 in AURORA and q < 0.02 in AURORA-RAP-GEICAM). Significant signatures are row ordered from high to low according to β coefficients (or regression coefficients) and divided according to upregulated (positive) or downregulated (negative) in metastasis. Patients are column ordered according to PAM50 molecular subtype and divided according to primary and metastasis. Signatures scores were calculated in the Level 4 RNAseq data (see Methods). Normal-like tumors and post-treatment primaries were removed from the analysis. For more information about the background/origin of the signatures listed in this figure, see Supplementary Table 3, sheet 2. LumA, Luminal A; LumB, Luminal B; LN, lymph node.

