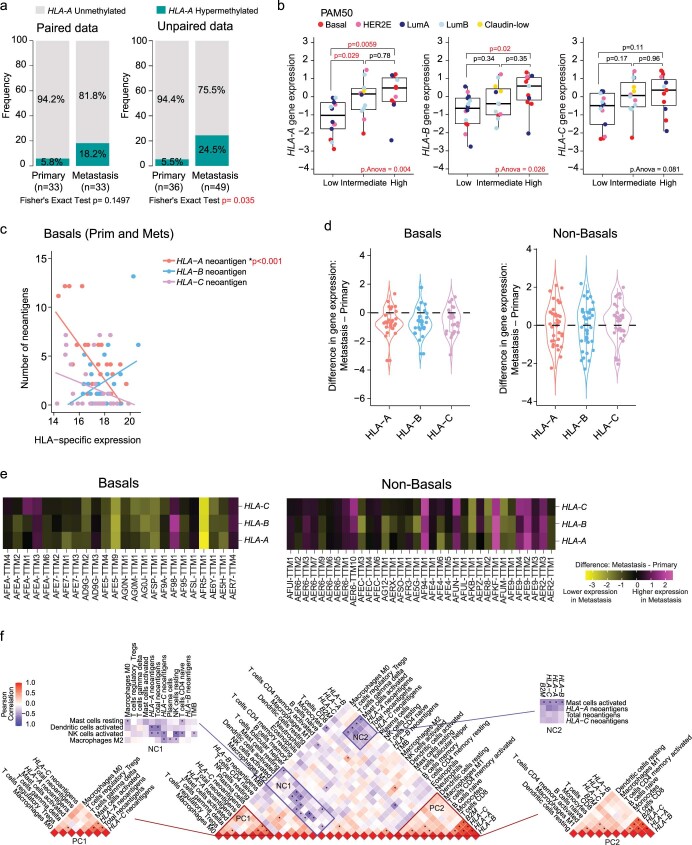
Extended Data Fig. 6. HLA-A gene and protein expression levels in metastatic samples and impact on immune-related features in metastatic tumors.
a. Bar plot depicting the frequency of HLA-A Unmethylated, and HLA-A methylated samples divided by primary and metastatic tumors. Fisher’s exact test was used to compare the proportion of categories (the number of samples is shown in the figure). b. Boxplots of HLA-A, -B, and C mRNA gene expression levels and according to HLA-A protein expression (n = 37 metastasis). HLA-A protein expression values were divided into tertiles on the basis of low (lower third; n = 14), intermediate (middle third; n = 12), or high intensity (upper third, n = 11). Comparison between more than 2 groups was performed by ANOVA with post hoc Tukey’s test, one-sided. Statistically significant values are highlighted in red. Comparisons between 2 paired groups were performed by t-test. Comparison between more than 2 groups was performed by ANOVA with post hoc Tukey’s test, one-sided. All Box-and-whisker plots display the median value on each bar, showing the lower and upper quartile range of the data (Q1 to Q3) and data outliers. The whiskers represent the lines from the minimum value to Q1 and Q3 to the maximum value. Normal-like samples were removed from this analysis. Statistically significant values are highlighted in red. c. Linear relationship between number of neoantigens and HLA-A, -B and C gene expression Level 4 RNAseq data (see Methods) of basal-like only primary and metastatic tumors. The correlation was measured using the Pearson correlation coefficient. d. Violin plots showing changes in gene expression for HLA-A, -B, and -C between primary and metastatic samples (Difference: Metastasis – Primary gene expression values) in basals (right panel, n = 34 tumors) and luminals/HER2E metastatic tumors (right panel, n = 34 tumors). e. Patient-specific changes in gene expression for HLA-A, -B, and -C between primary and metastatic samples (Difference: Metastasis – Primary gene expression values) in basal-likes, (left panel, n = 24 tumors) and luminals/HER2E metastatic tumors (right panel, n = 34 tumors) of AURORA cohort. Normal-like paired and unpaired tumors were removed from this analysis (Paired Normal and unpaired group from the ‘Pairs-PAM50-Prim’ column of Supplementary Table 2). f. Correlation matrix and unsupervised hierarchical clustering of CIBERSORTx-based immune-cell scores in basal-like samples (n = 42, 17 primary and 25 Metastasis). Positive clusters (PC1 and PC2) and negative clusters (NC1 and NC2) reflect the highest or lowest correlated immune-related signature scores per CIBERSORTx. Correlation was measured using the Pearson correlation coefficient and p values <0.05 are shown as (*). ns, non-significant. Prim, primary; Met, metastasis; LumA, Luminal A; LumB, Luminal B.

