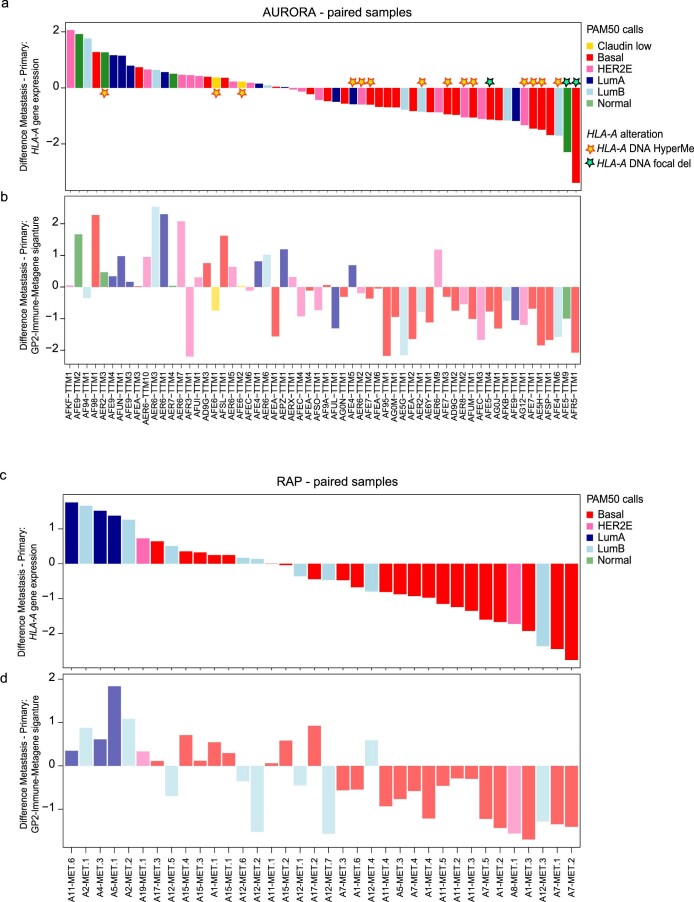
Extended Data Fig. 7. Difference in HLA-A and immune-signature expression between primary and metastatic tumors.
a. Waterfall plot of AURORA cases showing the difference between primary (n = 36 tumors) and metastasis (n = 60 tumors) (Difference: Metastasis – Primary gene expression value) ordered from the highest (left) to the lowest (right) signature score for HLA-A mRNA expression (upper panel). The bottom panel shows the difference between primary and metastases for GP2-Immune-Metagene values. Yellow stars highlight HLA-A Hypermethylated cases and green stars highlight the samples with DNA HLA-A focal deletions. b. Waterfall plot of RAP cases showing the difference between primary (n = 12 tumors) and metastasis (n = 40 tumors) (Difference: Metastasis – Primary gene expression value) ordered from the highest (left) to the lowest (right) signature score for HLA-A mRNA expression (upper panel). The bottom panel shows the difference of primary versus metastases for GP2-Immune-Metagene values. Pairs with a Normal-like primary tumor were removed from the analysis. LumA, Luminal A; LumB, Luminal B.

