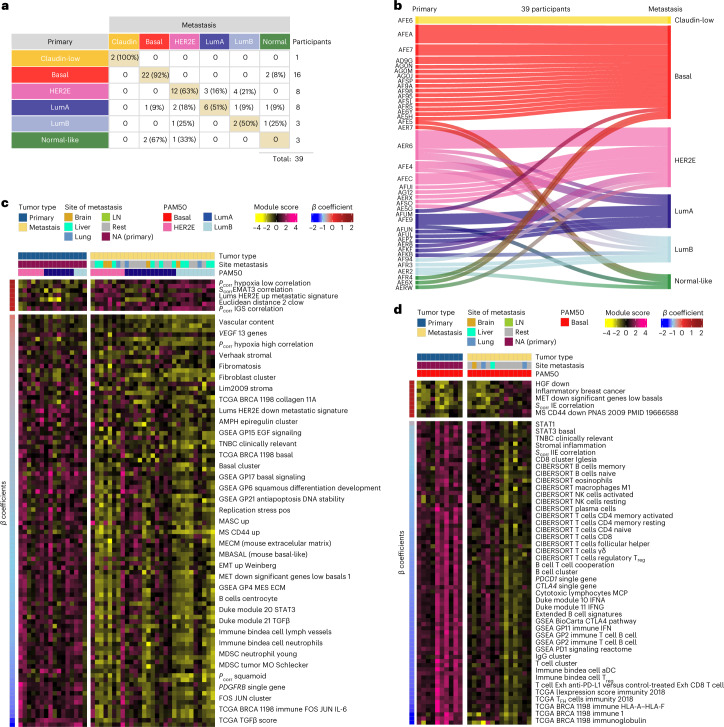
Fig. 2. Subtype switching and supervised analysis of gene expression signatures between primary and metastatic tumors.
a, Overall molecular intrinsic subtype change between 39 participant-matched primary breast and 1 or more metastatic tumors. b, Participant-specific molecular subtype changes in 39 participant-matched primary breast and 1 or more metastatic tumors. c,d, Heat maps of some representative signatures that are significantly different between primary and metastatic tumors in luminal/HER2E (n = 16 primary versus 29 metastatic tumors; c) and basal-like only subtypes (n = 10 primary versus 14 metastatic tumors; d). Significance of the differences between primary tumors and metastases were calculated using LMMs (q < 0.01). Significant signatures are row ordered from high to low according to ꞵ-coefficients (or regression coefficients) and divided according to upregulated (positive) or downregulated (negative) in metastasis. Individuals are column ordered according to PAM50 molecular subtype and divided according to primary tumor and metastasis. Signature scores were calculated in the level 4 RNAseq data (Methods). Normal-like tumors and post-treatment primaries were removed from the analysis in the AURORA cohort. For more information about the background/origin of the signatures listed in c and d, see Supplementary Table 3, sheet 2. LumA, Luminal A; LumB, Luminal B; LN, lymph node.

