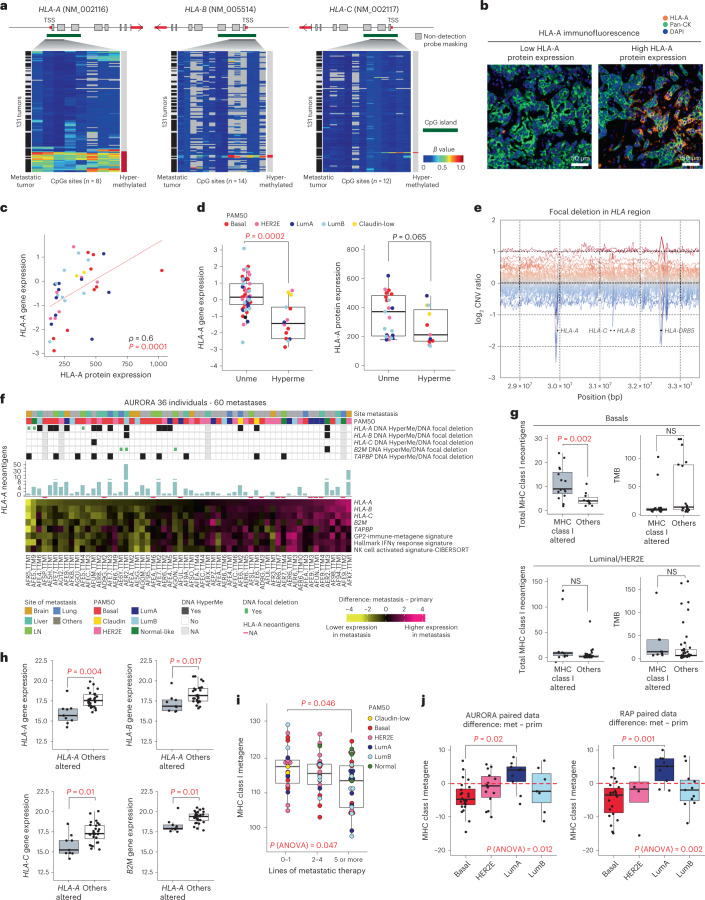
Fig. 4. HLA-A dysregulation and impact on immune-related features in metastatic tumors.
a, Hypermethylated CpG sites in HLA-A (8 CpG sites), HLA-B (14 CpG sites) and HLA-C (12 CpG sites) of 133 primary and metastatic tumors; TSS, transcription start site. b, Representative images of 37 metastatic samples showing HLA-A immunofluorescence staining for two different levels of HLA-A protein expression (top third and bottom third). HLA-A protein expression values were divided into tertiles on the basis of low (lower third), intermediate (middle third) or high intensity (upper third). c, Correlation analysis of HLA-A protein expression and HLA-A gene expression values (n = 37 metastases). The correlation was measured using the Spearman correlation coefficient. d, Box plots of HLA-A mRNA gene expression levels in metastases (left; n = 75 metastatic tumors) and HLA-A protein expression (right; n = 34 metastatic tumors) according to DNA methylation status when data were available. e, HLA-A, HLA-B, HLA-C and HLA-DRB5 focal deletions in the HLA region of 49 individuals. f, Heat map representation of the difference in HLA-A, HLA-B, HLA-C, B2M and TAPBP gene expression values and GP2-immune-metagene and hallmark interferon-γ (IFNγ) response gene signature scores, calculated between paired primary (n = 36) and metastatic (n = 60) tumors. Normal-like paired and unpaired tumors were removed from this analysis (paired normal and unpaired group from the ‘Pairs-PAM50-Prim’ column of Supplementary Table 2). Gene and signature scores are ordered according to HLA-A gene expression changes. For the 60 metastases, the association is shown with HLA-A, HLA-B, HLA-C, B2M and TAPBP gene methylation/DNA focal deletion status, PAM50 and site of metastasis; NK, natural killer. g, Left, MHC class I-associated neoantigen levels in MHC class I-altered tumors (HLA-A, HLA-B, HLA-C, B2M and TAPBP hypermethylation or focal deletion) versus non-altered tumors (Others) when data were available (basal-like tumors: n = 25, 5 primaries and 20 metastases; luminal/HER2E tumors: n = 39, 9 primaries and 30 metastases). Right, TMB in MHC class I-altered tumors versus in other tumors when data were available (basal-like tumors: n = 35, 11 primaries and 24 metastases; luminal/HER2E tumors: n = 52, 15 primaries and 37 metastases); NS, not significant. h, HLA-A, HLA-B, HLA-C and B2M gene expression values are shown in HLA-A-altered versus other tumors when data were available (n = 37, 13 primaries and 24 metastases). i, MHC class I metagene signature scores according to lines of therapies in metastatic samples (N = 77). j, MHC class I metagene signature score differences between primary and metastatic tumors according to molecular subtype in AURORA (n = 46) and RAP (n = 57) cohorts. Normal-like tumors were removed from the analysis. All box and whisker plots of the figure display the median value on each bar, showing the lower and upper quartile range of the data (Q1 to Q3) and data outliers. The whiskers represent the lines from the minimum value to Q1 and Q3 to the maximum value. All comparisons between more than two groups were performed by ANOVA with a post hoc Tukey test (one sided), and P values are shown in red (i and j). Comparison between only two groups was performed by unpaired Mann–Whitney test (two sided), and significant P values are highlighted in red (d, g and h). LumA, Luminal A; LumB, Luminal B; LN, lymph node; Unme, unmethylated; HyperMe, hypermethylated.

