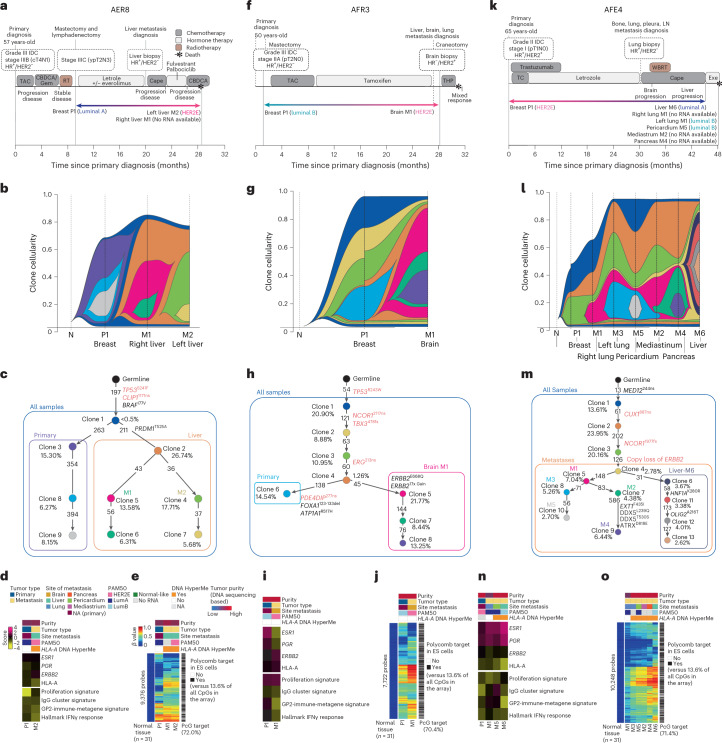
Fig. 6. Multiomics participant characterization of individual AURORA cases.
a–o, Timeline of participant clinical history (a, f and k), clonal structure (b, g and l), clonal evolution (c, h and m) and transcriptome (d, i and n) and methylome description (e, j and o) of participants AER8 (a, b, c, d and e), AFR3 (f, g, h, i and j) and AFE4 (k, l, m, n and o). Transcriptome data reflect gene expression values, and gene expression signatures were calculated using normalized RNAseq data; LumA, Luminal A; LumB, Luminal B; P, primary; M, metastasis; N, AQ21normal; LN, lymph node; R. Lung, right lung; L. Lung, left lung; R. Liver, right liver; L. Liver, left liver; M, metastasis; ES, embryonic stem. PGR, progesterone; ESR1, estrogen receptor; TAC, docetaxel (Taxotere), doxorubicin hydrochloride (Adriamycin), and cyclophosphamide; CBDCA, carboplatin; Gem, gemcitabine; RT, radiation therapy; Cape, capecitabine; THP, docetaxel, trastuzumab, and pertuzumab; WBRT, whole brain radiation therapy.

