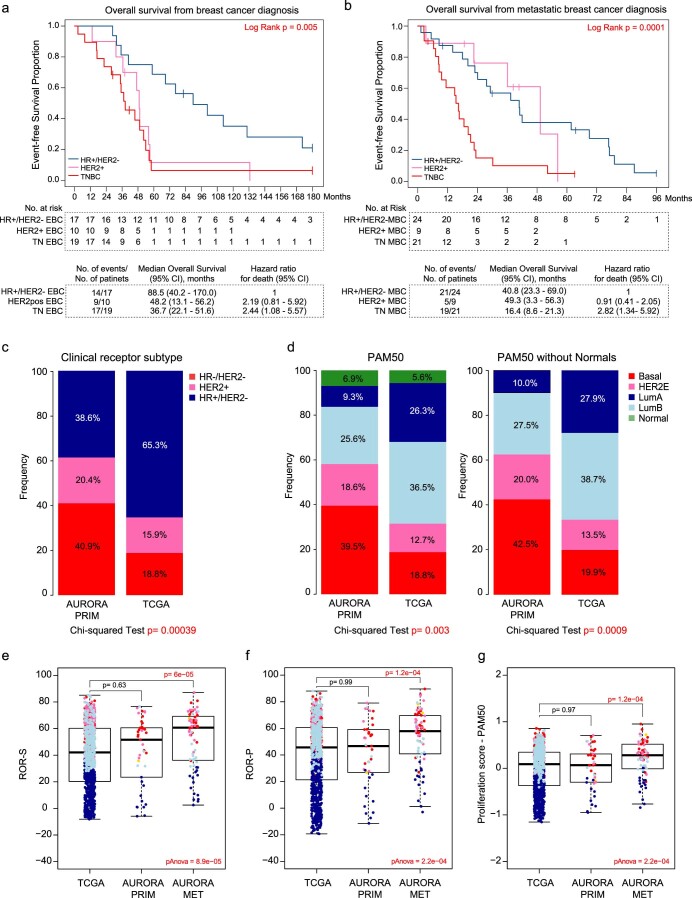
Extended Data Fig. 1. Survival outcomes according to clinical subtypes of AURORA cohort.
a. Kaplan-Meier, log-rank test and Cox proportional hazards regression model methods were used to study the overall survival from breast cancer diagnosis (‘First Primary Receptor at diagnosis’ column of Supplementary Table 2) in HER2 positive (HER2+, n = 10 patients), Hormone receptor positive and HER2 negative (HR + /HER2-, n = 17 patients) and TNBC (triple-negative breast cancers, n = 19 patients). b. Kaplan-Meier, the log-rank test and Cox proportional hazards regression model to study the overall survival from metastatic breast cancer diagnosis (‘Metastasis original receptors’ column of Supplementary Table 2) in HER2 + (n = 9 patients), HR + /HER2- (n = 24 patients) and TNBC (n = 21 patients). In absence of HR/HER2 status in the metastatic relapse we used the data from the most recent biopsy. c-d. Frequency bar chart displaying the frequency of clinical subtype (c) and molecular subtype (d) in AURORA (n = 123 tumors) compared with TCGA (n = 1027 tumors). In the AURORA cohort, we assigned ER and HER2 clinical status to those samples that had missing clinical values using the mRNA surrogates. e-g. Boxplot displaying the risk of recurrence based on subtype (ROR-S) (e) and proliferation (ROR-P) (f) and Proliferation score from PAM50 predictor (g) comparing TCGA primary tumors (n = 1027 tumors) vs AURORA primary tumors (n = 44 tumors) vs AURORA metastatic tumors (n = 70 tumors). Statistically significant values are highlighted in red. Comparison between more than 2 groups was performed by ANOVA with post hoc Tukey’s test, one-sided (panels e, f, and g). Normal-like samples were removed from this analysis. Box-and-whisker plots from panels e, f, and g, display the median value on each bar, showing the lower and upper quartile range of the data (Q1 to Q3) and data outliers. The whiskers represent the lines from the minimum value to Q1 and Q3 to the maximum value. EBC, early breast cancer; MBC, metastatic breast cancer; confidence interval (CI). Statistically significant values are highlighted in red.

