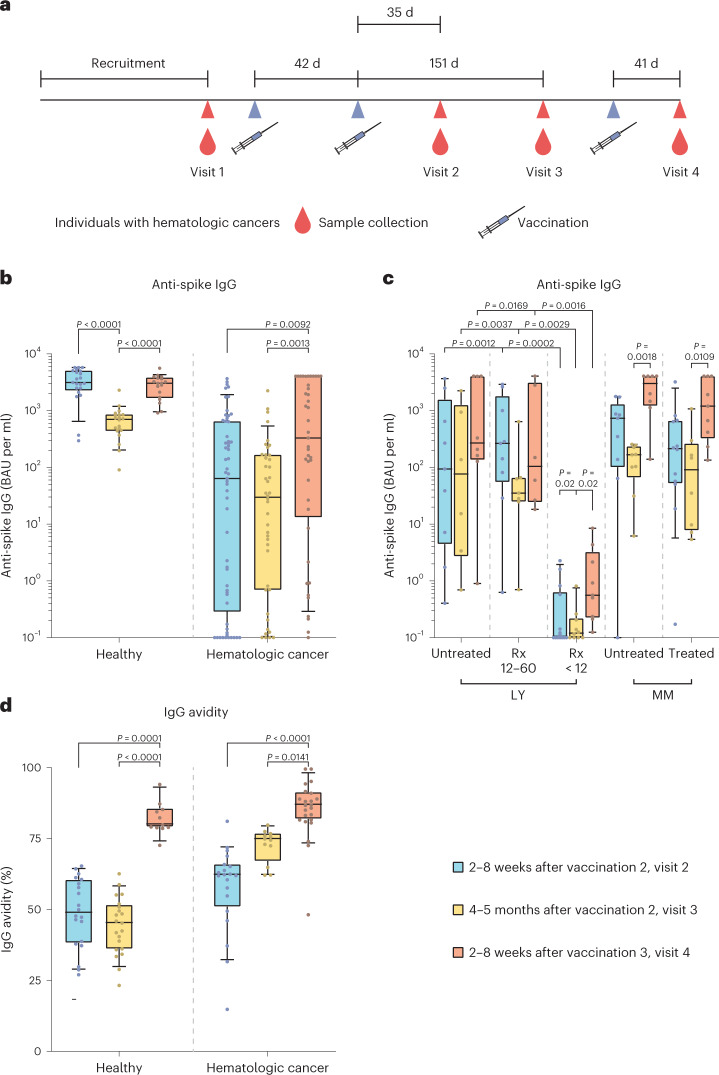
Fig. 1. Study time chart, anti-spike IgG levels and IgG avidity in individuals with hematologic neoplasia and in healthy individuals at different time points after COVID-19 vaccination.
a, Time chart of the study depicting time points of vaccination and blood sample collection in a cohort of individuals with hematologic cancers. Prevaccination samples were collected shortly before vaccination 1 (visit 1). Visit 2 occurred 2–8 weeks (median of 35 d) after vaccination 2. Visit 3 occurred 4–5 months (median of 149 d) after vaccination 2. Visit 4 occurred 2–8 weeks (median of 40 d) after vaccination 3. Vaccinations 1 and 2 were administered 6 weeks apart (median of 42 d); vaccinations 2 and 3 were 6 months apart (median of 189 d). b–d, Data are depicted as box plots with median, bounds between upper and lower quartiles and whiskers between the 10th and 90th percentiles. Differences between time points (visit 2, blue; visit 3, yellow; visit 4, red) were analyzed for statistical significance using the Kruskal–Wallis test with Dunn’s multiple-testing correction. Brackets show statistically significant differences, and precise numerical P values are indicated. Absence of brackets indicates absence of significance. b, Anti-spike S1 domain IgG titers in BAU per ml at different time points after vaccinations 2 and 3. The following samples were analyzed for groups of healthy individuals and individuals with hematologic neoplasia: 2–8 weeks after vaccination 2 (visit 2, blue; N = 21/N = 57), 4–5 months after vaccination 2 (visit 3, yellow; N = 20/N = 42) and 2–8 weeks after vaccination 3 (visit 4, red; N = 19/N = 42). c, Levels of antibody specific to the spike S1 domain after vaccinations 2 and 3 comparing subgroups of individuals with hematologic neoplasia; untreated LY (visit 2, N = 9; visit 3, N = 6; visit 4, N = 8)/LYs treated with Rx 12–60 months before receiving the first vaccination (Rx 12–60; visit 2, N = 9; visit 3, N = 7; visit 4, N = 6)/LYs treated with Rx in the last 12 months before the first vaccination (Rx < 12; visit 2, N = 14; visit 3, N = 10; visit 4, N = 9)/untreated MM (visit 2, N = 9; visit 3, N = 9; visit 4, N = 8)/treated MM (visit 2, N = 12; visit 3, N = 8; visit 4, N = 9). d, Avidity of anti-spike IgG at different time points after vaccinations 2 and 3; healthy individuals: visit 2 (N = 20)/visit 3 (N = 21)/visit 4 (N = 11); individuals with hematologic malignancies: visit 2 (N = 20)/visit 3 (N = 12)/visit 4 (N = 23).

