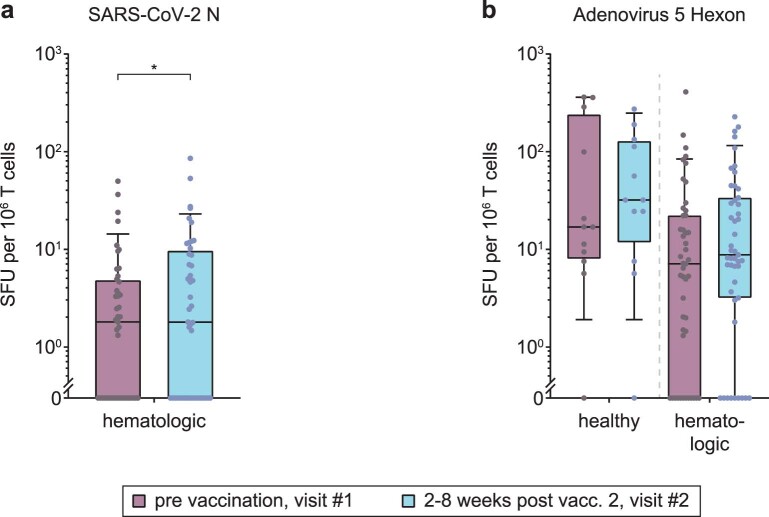
Extended Data Fig. 5. SARS-CoV-2 nucleocapsid- and adenovirus 5 hexon-specific T-cell responses in healthy individuals and patients with hematologic malignancies before and after the second COVID-19 vaccination.
T-cell responses analyzed by IFN-γ ELISpot and expressed as spot-forming units (SFU) per 106 T cells are shown as box plots with median, bounds between upper and lower quartiles, and whiskers between the 10th and 90th percentiles. Results from infection-naive healthy individuals and patients with hematologic malignancies before vaccination (visit #1, purple) and after the second vaccine dose (visit #2, blue) are shown in (a, b): Responses to a peptide pool for SARS-CoV-2 nucleocapsid (hematological patients: visit #1/visit #2: n = 45/45, respectively) are shown in (a), and to a peptide pool for adenovirus 5 hexon protein (healthy individuals: visit #1/visit #2: n = 12/12, respectively; hematological patients: visit #1/visit #2: n = 47/47, respectively; the six patients who had received a dose of the adenoviral AstraZeneca vaccine were excluded) in (b). Brackets show statistically significant differences. Absence of brackets or p-values indicates absence of significance.

