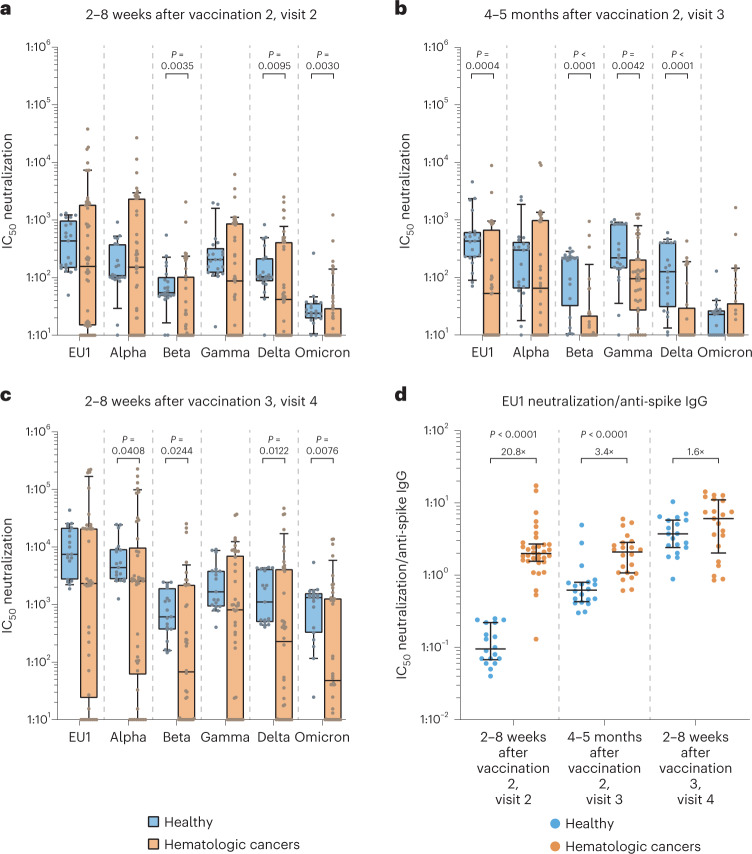
Fig. 2. Comparison of infection neutralization activities for SARS-CoV-2 VoCs in individuals with hematologic neoplasia and healthy individuals at different time points after COVID-19 vaccination.
Serum dilutions for half-maximal infection neutralization capacities normalized to 107 viral RNA copies (neutralization IC50 values) are depicted for different SARS-CoV-2 variants as box plots with median, bounds between upper and lower quartiles and whiskers between the 10th and 90th percentiles. Differences between groups were tested for their statistical significance using the Mann–Whitney test. Brackets show statistically significant differences, and precise numerical P values are indicated. Absence of brackets or P values indicates absence of significance. a, Neutralization IC50 values at 2–8 weeks after vaccination 2 (visit 2) for SARS-CoV-2 variants in healthy individuals (N = 21) versus in individuals with hematologic malignancies (N = 56). b, Neutralization IC50 values at 4–5 months after vaccination 2 (visit 3) for SARS-CoV-2 variants (EU1, Alpha, Beta, Gamma, Delta and Omicron BA.1, respectively) in healthy individuals (N = 21, 21, 21, 21, 21 and 21, respectively) versus in individuals with hematologic malignancies (N = 36, 36, 36, 36, 36 and 36, respectively). c, Neutralization IC50 values at 2–8 weeks after vaccination 3 (visit 4) for SARS-CoV-2 variants (EU1, Alpha, Beta, Gamma, Delta and Omicron BA.1, respectively) in healthy individuals (N = 19, 19, 19, 19, 19 and 19, respectively) versus in individuals with hematologic malignancies (N = 42, 42, 42, 42, 42 and 42, respectively). d, Ratios between infection neutralization IC50 values for EU1 values and anti-spike S1 domain titers at visits 2, 3 and 4, respectively, comparing vaccinated healthy individuals (N = 18, 20 and 19, respectively) and individuals with hematologic malignancies (N = 34, 22 and 21, respectively). Medians and IQRs (error bars) are depicted.

