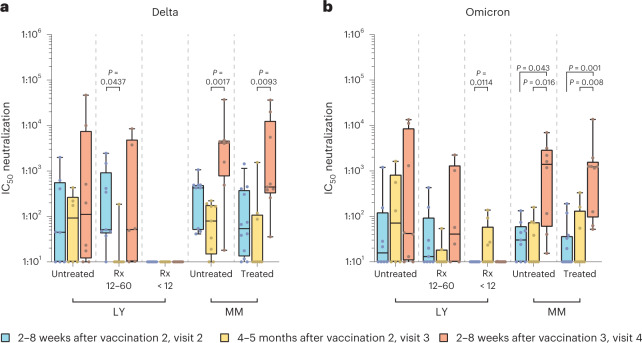
Fig. 3. Longitudinal comparison of infection neutralization activities against Delta and Omicron in sera from subgroups of individuals with hematologic neoplasia.
a, Infection neutralization IC50 values for the Delta VoC. b, Infection neutralization IC50 values for the Omicron (BA.1) VoC. Neutralization IC50 values in serum are depicted for different SARS-CoV-2 variants as box plots with median, bounds between upper and lower quartiles and whiskers between the 10th and 90th percentiles. Differences between time points were tested for their statistical significance using the Kruskal–Wallis test with Dunn’s multiple-testing correction. Brackets show statistically significant differences, and precise numerical P values are indicated. Absence of brackets or P values indicates absence of statistical significance. Sera from the following subgroups of individuals were analyzed at visit 2 (blue), visit 3 (yellow) and visit 4 (red); untreated LY (Delta VoC: visit 2/visit 3/visit 4: N = 8/6/8, respectively; Omicron (BA.1) VoC: visit 2/visit 3/visit 4: N = 8/6/8, respectively); individuals with LY treated with Rx 12–60 months before receiving the first vaccination (Rx 12–60; Delta: visit 2/visit 3/visit 4: N = 9/7/6, respectively; Omicron (BA.1): visit 2/visit 3/visit 4: N = 9/7/6, respectively); individuals with LY treated with Rx in the last 12 months before the first vaccination (Rx < 12; Delta: visit 2/visit 3/visit 4: N = 14/9/10, respectively; Omicron (BA.1): visit 2/visit 3/visit 4: N = 14/9/9, respectively); untreated MM (Delta: visit 2/visit 3/visit 4: N = 9/9/8, respectively; Omicron (BA.1): visit 2/visit 3/visit 4: N = 9/8/8, respectively); treated MM (Delta: visit 2/visit 3/visit 4: N = 12/8/9, respectively; Omicron (BA.1): visit 2/visit 3/visit 4: N = 12/8/9, respectively).

