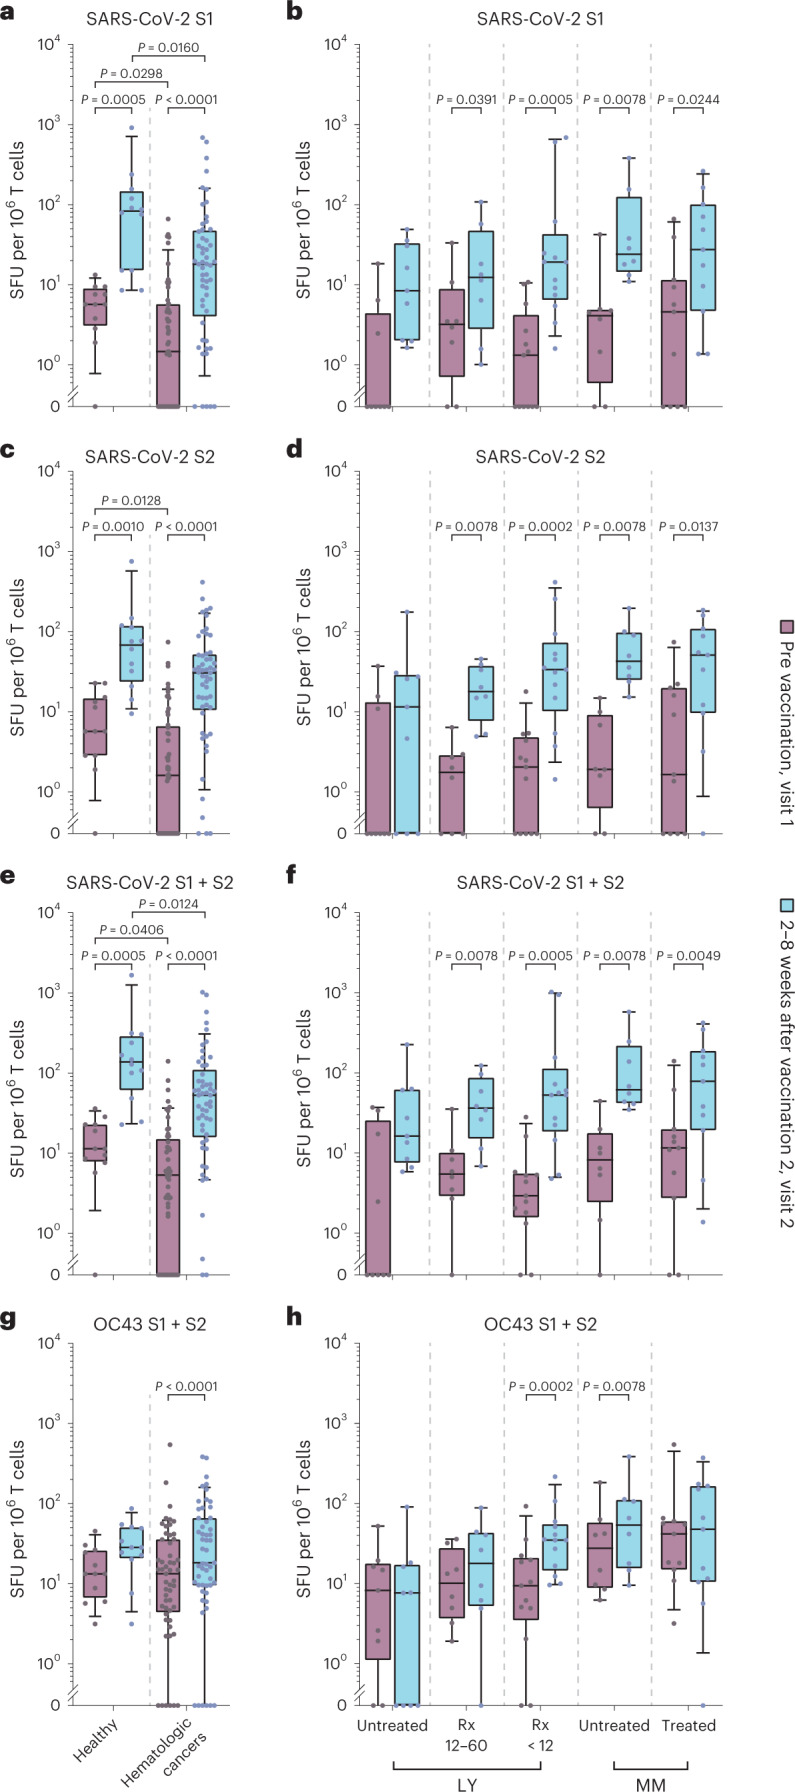
Fig. 4. SARS-CoV-2- and OC43-specific T cell responses in individuals with hematologic malignancies before and after two-dose COVID-19 mRNA vaccination.

T cell responses analyzed by IFNγ ELISpot and expressed as SFU per 106 T cells are shown as box plots with median, bounds between upper and lower quartiles and whiskers between the 10th and 90th percentiles. Samples were obtained before vaccination 1 (visit 1) or at 2–8 weeks after vaccination 2 (visit 2). Differences between time points were analyzed for statistical significance using the Wilcoxon matched-pairs signed-rank test, and differences between healthy donors and individuals with hematologic malignancies were analyzed using the Mann–Whitney test. Brackets show statistically significant differences, and precise numerical P values are indicated. Absence of brackets or P values indicates absence of statistical significance. a,b, T cell responses to SARS-CoV-2 spike S1. c,d, T cell responses to SARS-CoV-2 spike S2. e,f, Sum of T cell responses to SARS-CoV-2 spike S1 and S2. g,h, Sum of T cell responses to human coronavirus OC43 spike S1 and S2. Results in a, c, e and g are shown for infection-naive healthy individuals (visit 1: N = 12/visit 2: N = 12) versus individuals with hematologic malignancies (visit 1: N = 53/visit 2: N = 53). Results in b, d, f and h are shown for infection-naive individuals with hematologic malignancies split into five subgroups: individuals with LY never treated with Rx or last treated more than 5 years before vaccination (untreated), individuals with LY last treated with Rx 12–60 months before vaccination (Rx 12–60), individuals with LY treated with Rx within 12 months before vaccination (LY < 12), individuals with MM not receiving therapy at the time of vaccination (untreated) and individuals with MM receiving therapy at the time of vaccination (treated). The number of individuals with hematologic neoplasia in these subgroups was as follows: untreated LY (visit 1, N = 9; visit 2, N = 9)/Rx 12–60 (visit 1, N = 8; visit 2, N = 8)/Rx < 12 (visit 1, N = 13; visit 2, N = 13)/untreated MM (visit 1, N = 8; visit 2, N = 8)/treated MM (visit 1, N = 11; visit 2, N = 11).
