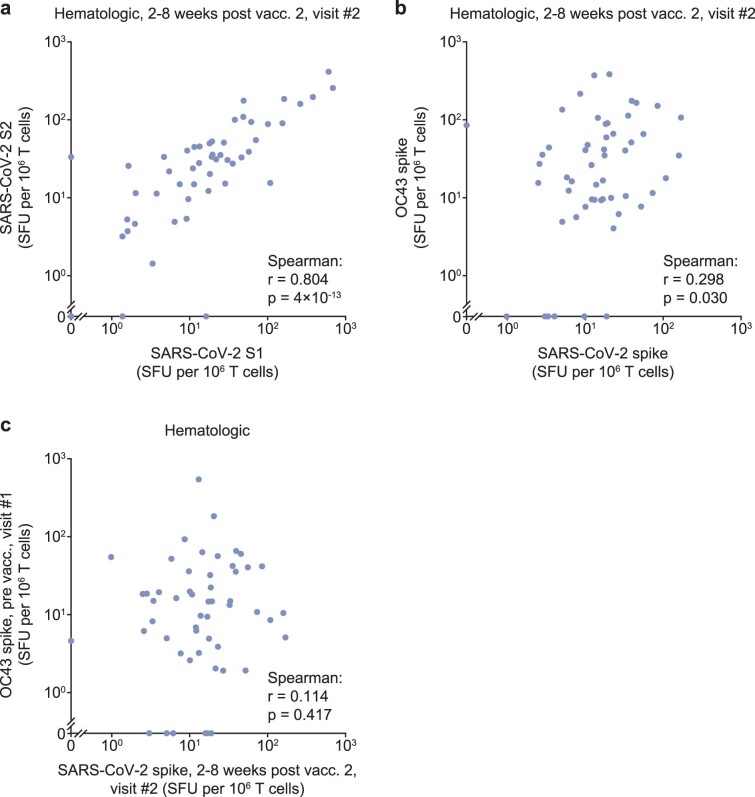
Extended Data Fig. 4. Correlation analysis of T-cell and antibody responses in hematologic patients at different time points before and after COVID-19 vaccination.
Dot plots of T-cell responses analyzed by IFN-γ ELISpot and expressed as spot-forming units (SFU) per 106 T cells as well as anti-SARS-CoV-2 spike S1 domain antibody responses in BAU/mL. Two-tailed Spearman’s rank correlation analysis was performed to calculate correlation coefficients (r) and analyze statistical significance. a, Correlation of T-cell responses to peptide pools for SARS-CoV-2 VoC delta spike S1 and S2 domain in 53 patients with hematologic neoplasia at 2-8 weeks post vaccination #2. b, Correlation of T-cell responses to peptide pools for Delta spike or for human coronavirus (hCoV) OC43 in 53 patients with hematologic neoplasia at 2-8 weeks post vaccination #2. c, Correlation of T-cell responses to peptide pools for Delta spike, 2-8 weeks post vaccination #2, and for hCoV-OC43 prior to vaccination in 53 patients with different hematologic neoplasia.

