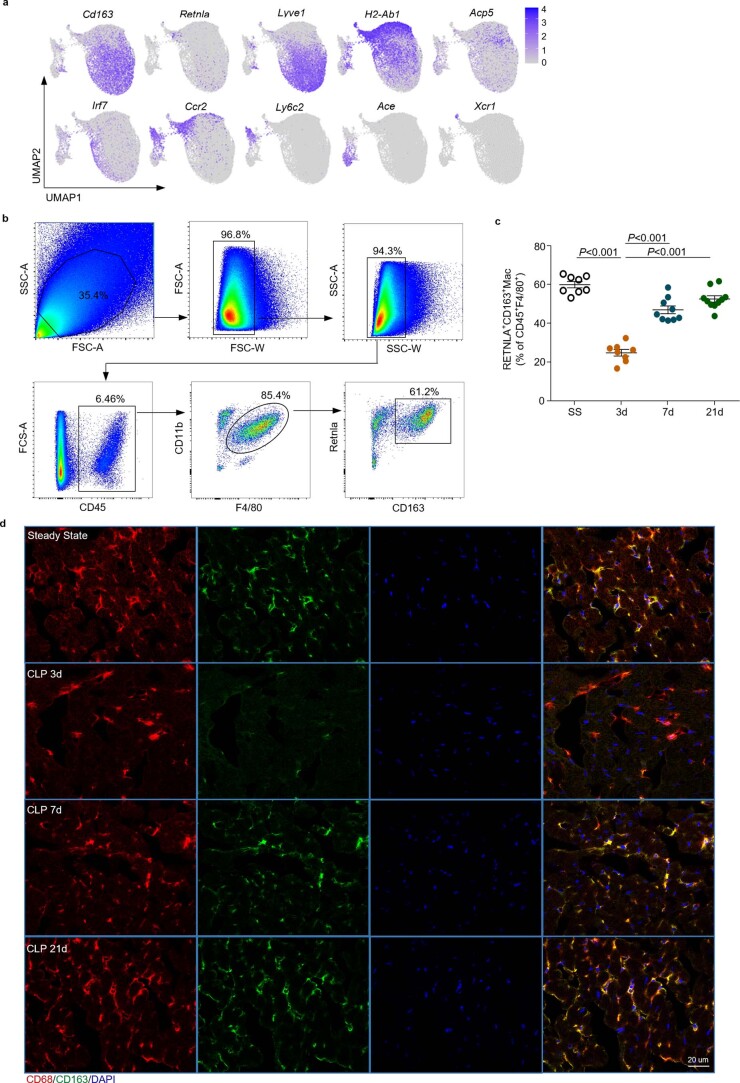
Extended Data Fig. 3. Identification of Mac1 subset in the septic heart, related to Fig. 2.
a, UMAP plots showing the expression of selected marker genes for the monocyte-macrophage subpopulations. b, Gating strategy to identified Mac1 cells (CD45+CD11b+F4/80+CD163+RETNLA+). c, Graph showing percentages of CD163+RETNLA+ cardiac macrophages during sepsis progression (SS, n = 8 mice; CLP 3 d, n = 8 mice; CLP 7 d, n = 9 mice; CLP 21 d, n = 10 mice). Each symbol represents one animal. Bars show mean ± SEM. Two-sided P values were determined by one-way ANOVA with Games-Howell’s multiple comparisons test. d, Representative immunofluorescence images showing the presence of CD163 (green), CD68 (red), and nuclei (blue) in cardiac tissues during sepsis progression. n = 6 mice per group. Scale bars, 20 μm. Exact P values are shown. Results represent four independent experiments (c,d). SS, steady state.

