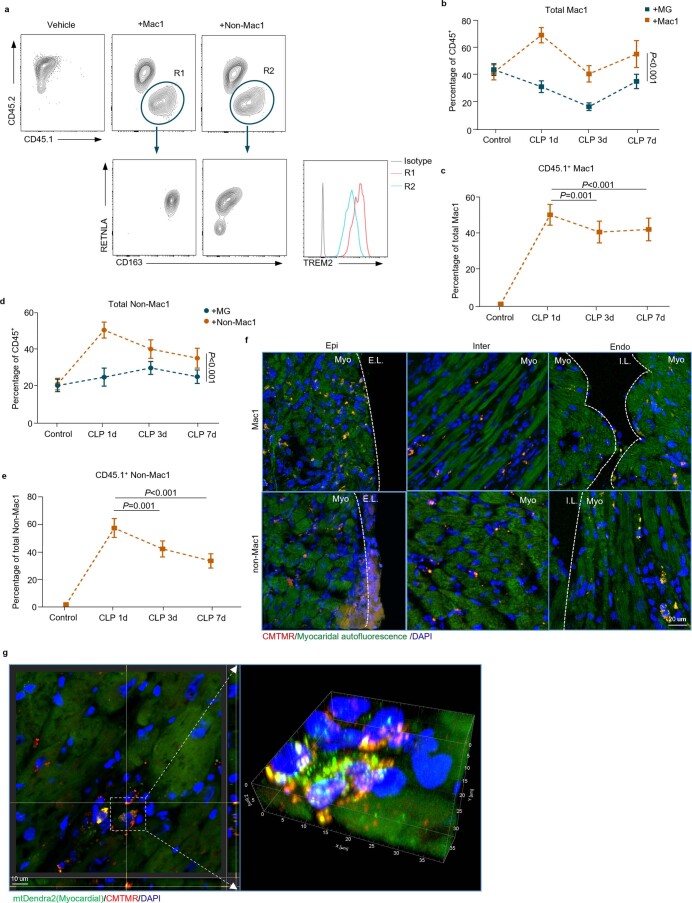
Extended Data Fig. 9. Transplanted cardiac macrophages are detected by flow cytometry and immunofluorescence, related to Fig. 7.
a, TREM2hi Mac1 cells (CD45+CD11b+F4/80+CD163+RETNLA+) and non-Mac1 (CD45+CD11b+F4/80+ and non-CD163+RETNLA+) cells were isolated from CD45.1 mice. Mac1 or non-Mac1 cells (2 × 10⁵ cells per mouse) were mixed with Matrigel (MG), and transplanted into the hearts of CD45.2 mice, respectively. Seven days after the transplantation, macrophages from hearts of recipients (CD45.2) were analyzed with flow cytometry assay. b,c, Graphs showing percentages of total Mac1 (b) and CD45.1+ Mac1 (c) cells within the CD45+ populations from hearts of recipients (CD45.2) at 1, 3, and 7 day(s) post the cell transplantation, respectively (n = 6 mice for each treatment). d,e, Graphs showing percentages of total non-Mac1 (d) and CD45.1+ non-Mac1 (e) cells within the CD45+ populations from hearts of recipients (CD45.2) at 1, 3, and 7 day(s) post the cell transplantation, respectively (n = 5-6 mice for each treatment). f,g, TREM2hi Mac1 cells (CD45+CD11b+F4/80+CD163+RETNLA+) and non-Mac1 (CD45+CD11b+F4/80+ and non-CD163+RETNLA+) cells were obtained from the hearts of WT mice by FACS and stained by CMTMR. Then, both types of cells (2 × 10⁵ cells/mouse mixed with Matrigel) were respectively injected into the pericardial cavity of recipient mice immediately after CLP. f, Representative immunofluorescence images showing the transplanted cells in the epicardium (Epi), intermyocardium (Inter), and endocardium (Endo) of recipient mice at 3 days post the cell transplantation. CMTMR (red) signals indicating Mac1 or non-Mac1 cells; epicardial layer (E.L.); myocardium (Myo); inner layer (I.L.). Scale bar, 20 μm. g, Representative immunofluorescence images showing the transplanted CMTMR labeled Mac1 cells in MitoCard mice at 3 days post CLP. 3D reconstruction images of the dashed box area, illustrating that cardiomyocyte-derived mitochondria (mtDendra2+, green) presented in the transplanted cells (CMTMR+, red). Nuclei were shown in blue (DAPI). Scale bar, 10 μm. n = 6 mice per group (f,g). Bars show mean ± SEM, Two-sided P values were determined by one-way ANOVA with multiple comparisons (b-e). Results represent four (b-e) and two (f,g) independent experiments.

