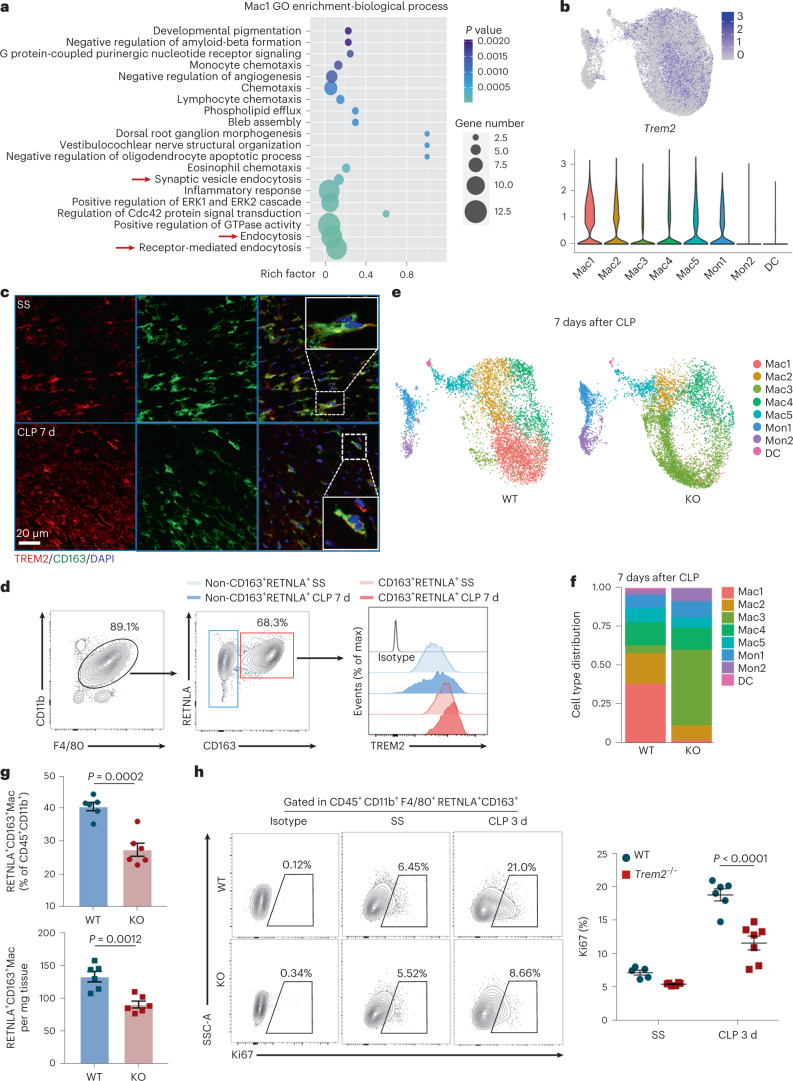
Fig. 4. TREM2 is highly expressed on Mac1 subset and essential for Mac1 cells self-renewal in SICM.
a, Dot plots showing the top 20 biological processes for the upregulated DEGs of Mac1 analyzed by GO. Red arrows indicate endocytosis-related pathways. b, UMAP plots and violin plots showing the expression of Trem2 in the monocyte-macrophage compartment. c, Representative immunofluorescence images of CD163 (green), TREM2 (red) and nuclei (blue) in cardiac tissue from WT mice at SS (n = 5) and 7 d after CLP (n = 5). The dotted lines indicate CD163+TREM2+ macrophages. Scale bars, 20 μm. d, Representative histograms of flow cytometric analysis of TREM2 expression in cardiac CD45+CD11b+F4/80+CD163+RETNLA+ and CD45+CD11b+F4/80+(non-CD163+RETNLA+) macrophages from WT mice at SS and 7 d after CLP. e, UMAP plots showing cell clustering results corresponding to Fig. 2a for a total of 13,405 monocytes-macrophages in WT and Trem2 knockout (KO) hearts at 7 d after CLP. f, Cluster distribution within the monocyte-macrophage subsets in WT and Trem2-KO hearts at 7 d after CLP. g, Percentages and absolute numbers of CD163+RETNLA+ macrophages analyzed by flow cytometry from hearts of WT (n = 6) and Trem2-KO (n = 6) mice at 7 d after CLP. h, Representative contour plots showing the expression of Ki67 on gated CD45+CD11b+F4/80+CD163+RETNLA+ macrophages and graph showing percentages of Ki67-expressing cells in WT (n = 5–6) and Trem2-KO (n = 6–7) hearts at SS and 3 d after CLP. Every symbol represents a mouse (g,h). Data are presented as mean ± s.e.m.; two-sided P values were determined by unpaired t-test (g) and one-way ANOVA with Sidak’s multiple comparisons test (h). Results represent three independent experiments (c,d,g,h). See also Extended Data Fig. 5.

