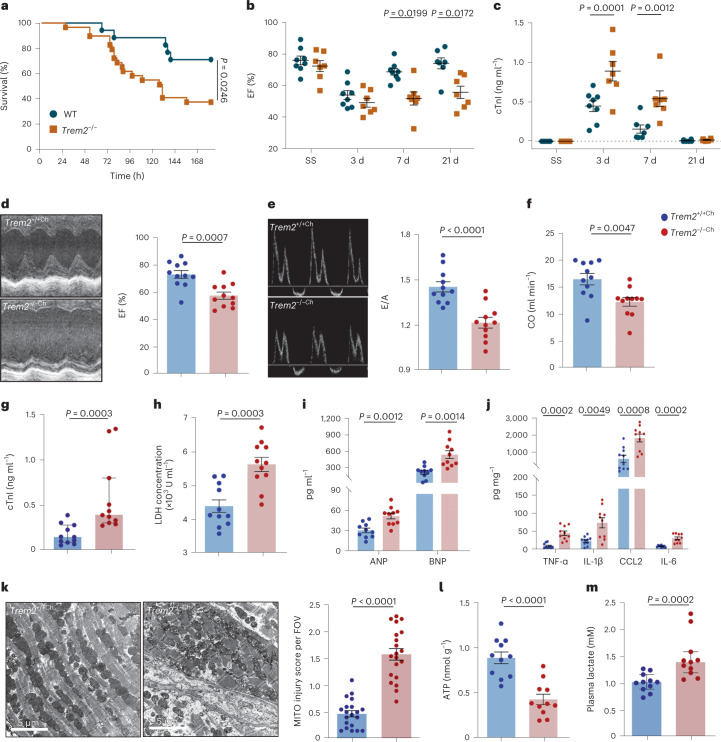
Fig. 6. Trem2 deficiency exacerbates the cardiac dysfunction following sepsis.
a, Survival analysis of WT (n = 18) and Trem2−/− (n = 30) mice after CLP performance was monitored for 7 d. b,c, WT and Trem2−/− mice were subjected to CLP and cardiac function was examined at SS and 3, 7 and 21 d after CLP. Graph showing EF % (b) measured by echocardiography (n = 7–8 mice for each group) and the levels of cTnI (c) in the serum (n = 5–8 mice for each group). d, Representative M-mode echocardiography images and EF % of WT → WT chimeras (Trem2+/+Ch) and Trem2−/−→WT chimeras (Trem2−/−Ch) 7 d after CLP. e, Representative continuous-wave Doppler echocardiography images and E/A ratio of Trem2+/+Ch and Trem2−/−Ch chimeras 7 d after CLP. f, Graph showing CO measured by echocardiography. g,h, Graphs showing the levels of cTnI (g) and LDH (h) in the serum of Trem2+/+Ch and Trem2−/−Ch chimeras 7 d after CLP (d–h, n = 11 mice for each group). i, Graphs showing protein levels of ANP and BNP in the serum of Trem2+/+Ch and Trem2−/−Ch chimeras 7 d after CLP. j, Graphs showing protein levels of tumor necrosis factor (TNF)-α, IL-1β, IL-6 and CCL2 in the heart tissues of Trem2+/+Ch and Trem2−/−Ch chimeras 7 d after CLP (i,j, n = 10 mice for each group). k, Representative TEM images (left) and mitochondria injury score (right) of Trem2+/+Ch and Trem2−/−Ch chimeras 7 d after CLP. Scale bars, 5 μm. Bar graph showing mitochondria injury score per FOV. Each symbol represents a FOV of TEM images. Each group has four mice and five FOVs were randomly selected for assay from each animal. l,m, Graphs showing the levels of ATP (l) in heart tissue lysates and the levels of serum lactate (m) of Trem2+/+Ch and Trem2−/−Ch chimeras 7 da after CLP (l,m, n = 11 mice for each group). Each symbol represents one animal (b–j,l,m). Bars show as mean ± s.e.m. (b–f,h–l) and median with interquartile range (g,m). Two-sided P values were determined by Kaplan–Meier log-rank test (a), two-way ANOVA with Sidak’s multiple comparisons test (b,c), unpaired t-test (d–f,h–k) and Mann–Whitney U-test (g,m). Results represent at least four (b,c) and three (d–m) independent experiments (Extended Data Fig. 8).

