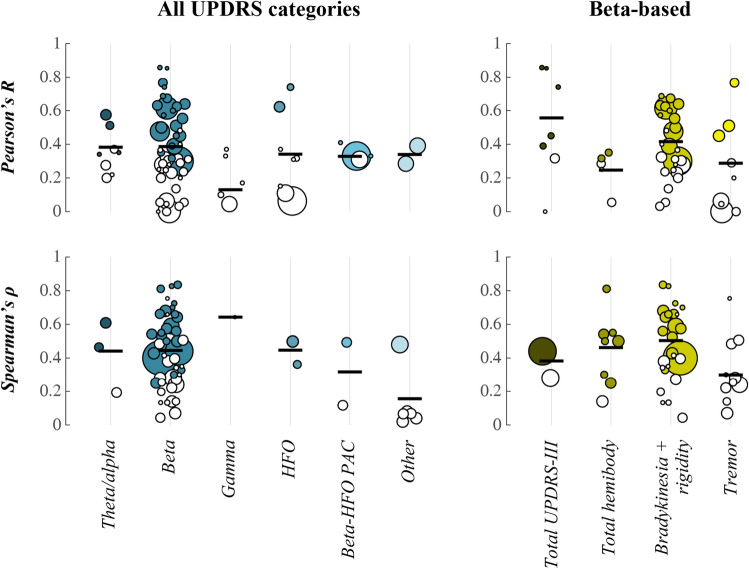
Fig. 1.
Distribution of correlation values and pooled effect sizes. Included data points are from Table 1 and 2. Filled circles represent correlation values that were deemed significant by the original study. Open circles represent non-significant correlation values. The size of circles reflects the number of hemispheres that were used in the correlation analysis. Black horizontal lines indicate the pooled effect size estimate across studies. Pearson’s R (top row) and Spearman’s ρ (bottom row) are visualised separately. All UPDRS categories include reported correlations for total UPDRS-III, total hemibody (bradykinesia + rigidity + tremor), hemibody bradykinesia + rigidity, and hemibody tremor items. These categories are visualised separately for beta-based LFP features on the right. Since the sign of the correlation was not necessarily comparable for different LFP measures, we opted for the use of absolute R and ρ values

