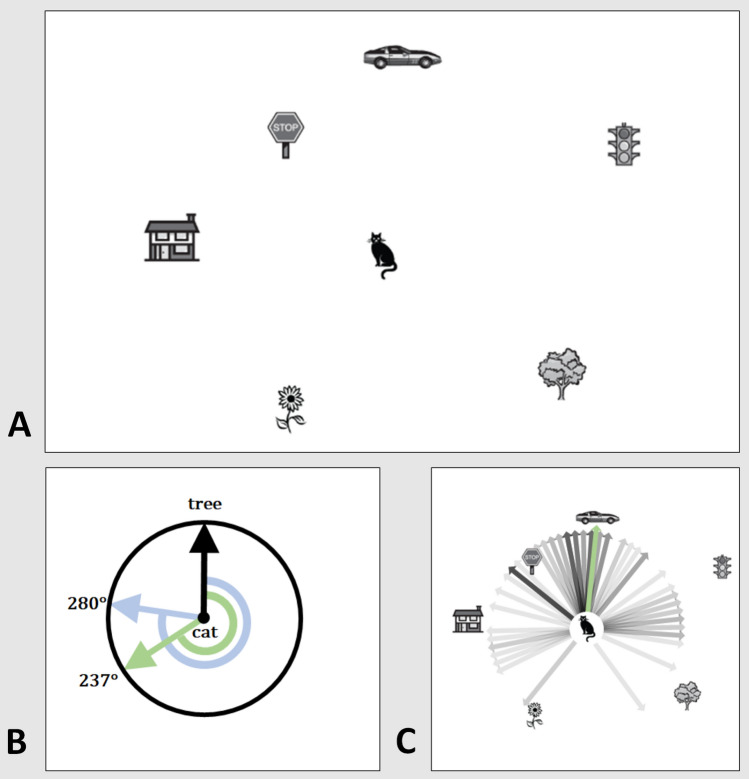
Fig. 1.
Schematic presentation of the two-dimensional paper-and-pencil test (SOT). a Subjects are shown a bird’s-eye-view of a map filled with seven objects and a task, e.g., “Imagine you are standing at the cat and facing the tree. Point to the car.” No annotations or real-world rotation of the test are allowed. b The relative direction should be indicated in the circle provided where the object in front of one’s virtual position is already indicated by an upward arrow (correct solution: green arrow and angle: 237°; example participant: light blue arrow and angle: 280°). Participant solutions are measured as mean deviation from correct solution in degrees on a unit circle (in this example: 43°). c Virtual rotation of participant solutions back onto the initial map showing large-scale angular deviations up to 170° in few participants (n = 104, light to dark gray arrows show participant solutions; darker lines represent multiple participants answering identical directions. Green arrow: correct solution as provided by the original authors). Modified from [3]

